Barlow-Vincent Elementary School
Rating
Not Available
Not Available

No Reviews Yet
Find Old Friends From Barlow-Vincent Elementary School
Use the form below to search for alumni from Barlow-Vincent Elementary School.
School Description
School Summary and Highlights
- Enrolls 789 preschool and elementary school students from grades PK-8
- Ranks 287th out of 1,038 middle schools in OH.
Additional Contact Information
- Principal or Admin: Stephanie D. Starcher
- Fax: (740) 678-0118
School District Details
- Warren Local School District
- Per-Pupil Spending: $8,242
- Graduation Rate: 92.7%
- Dropout Rate: 2.9%
- Students Per Teacher: 18.1
- Enrolled Students: 2,452
Faculty Details and Student Enrollment
Students and Faculty
- Total Students Enrolled: 789
- Total Full Time "Equivalent" Teachers: 43.3
- Average Student-To-Teacher Ratio: 18.2
Students Gender Breakdown
- Males: 399 (50.6%)
- Females: 385 (48.8%)
Free Lunch Student Eligibility Breakdown
- Eligible for Reduced Lunch: 53 (6.7%)
- Eligible for Free Lunch: 197 (25.0%)
- Eligible for Either Reduced or Free Lunch: 250 (31.7%)
Student Enrollment Distribution by Race / Ethnicity
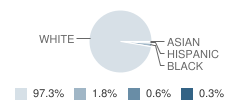
| Number | Percent | |
|---|---|---|
| American Indian | - | - |
| Black | 14 | 1.8% |
| Asian | 2 | 0.3% |
| Hispanic | 5 | 0.6% |
| White | 763 | 96.7% |
Number of Students Per Grade
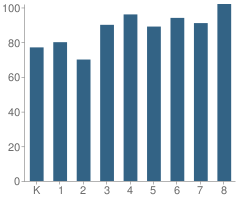
| Number | Percent | |
|---|---|---|
| Kindergarten | 77 | 9.8% |
| 1st Grade | 80 | 10.1% |
| 2nd Grade | 70 | 8.9% |
| 3rd Grade | 90 | 11.4% |
| 4th Grade | 96 | 12.2% |
| 5th Grade | 89 | 11.3% |
| 6th Grade | 94 | 11.9% |
| 7th Grade | 91 | 11.5% |
| 8th Grade | 102 | 12.9% |
Teacher Credentials & Experience (2010)
Percent of Teachers That Have at Least a Master's Degree
School:
74.5%
District:
81.6%
Percent of Teachers That Have at Least a Bachelor's Degree
School:
100.0%
District:
100.0%
Percent of Teachers That Are Properly Certified
School:
99.6%
District:
98.3%
Average Years of Teacher Experience
School:
17.0
District:
18.0
Average Teacher Salary
School:
$52,577
District:
$53,164
Source: OH Department of Education, Source: NCES 2009-2010
School Ratings and Reviews
Be The First To Review Barlow-Vincent Elementary School!
School Map and Similar Schools Nearby
Click to Activate Map of Nearby School Campuses
Private
Public
This School
Similar Schools Nearby
| Warren Elementary School PK-8 | 465 Students | 5.9 miles away |  5 out of 5 | |
| Waterford Elementary School PK-8 | 409 Students | 5.9 miles away | 5 out of 5 | |
| Belpre Elementary School PK-6 | 558 Students | 8.0 miles away | Not Yet Rated | |
| Little Hocking Elementary School PK-8 | 454 Students | 8.9 miles away | Not Yet Rated | |
| Harmar Elementary School PK-5 | 313 Students | 11.1 miles away | Not Yet Rated | |
| Beverly Elementary School PK-6 | 261 Students | 11.3 miles away | Not Yet Rated | |
| Washington Elementary School PK-5 | 356 Students | 11.3 miles away | Not Yet Rated | |
| Putnam Elementary School PK-5 | 256 Students | 11.6 miles away | Not Yet Rated | |
| Phillips Elementary School PK-5 | 404 Students | 12.3 miles away | Not Yet Rated | |
| Lowell Elementary School PK-6 | 112 Students | 13.0 miles away | Not Yet Rated | |
Compare This School To Nearby Schools ->
School Community Forum

Join a discussion about Barlow-Vincent Elementary School and talk to others in the community including students, parents, teachers, and administrators.
Popular Discussion Topics
- Admissions and Registration Questions (e.g. Dress Code and Discipline Policy)
- School Calendar and Upcoming Events (e.g. Graduation)
- After School Programs, Extracurricular Activities, and Athletics (e.g. Football)
- News and Announcements (e.g. Yearbook and Class Supply List Details)
- Graduate and Alumni Events (e.g. Organizing Class Reunions)
Navigation
Can't Find What You Are Looking For?
Nearby Cities
Sponsored Links
K-12 Articles

Halloween Safety Tips
Ghosts and witches sit beside mistletoe and tinsel on store shelves. Orange and black deck the...
Ghosts and witches sit beside mistletoe and tinsel on store shelves. Orange and black deck the...

Se Hablan Otras Idiomas?
In the late 1990s, the Salem-Keizer school district in Oregon began requiring every student in its...
In the late 1990s, the Salem-Keizer school district in Oregon began requiring every student in its...

Bullycide: What is It and How Can It Be Prevented?
Disclaimer: This article expresses my opinion that has been formed by personal experience and...
Disclaimer: This article expresses my opinion that has been formed by personal experience and...