Marion Local Elementary School
Rating
Not Available
Not Available

No Reviews Yet
Find Old Friends From Marion Local Elementary School
Use the form below to search for alumni from Marion Local Elementary School.
School Description
School Summary and Highlights
- Enrolls 624 preschool and elementary school students from grades PK-8
- Ranks 63rd out of 1,038 middle schools in OH.
Additional Contact Information
- Principal or Admin: Karen M. Post
School Operational Details
- Title I Eligible
School District Details
- Marion Local School District
- Per-Pupil Spending: $8,285
- Graduation Rate: 94.9%
- Students Per Teacher: 17.4
- Enrolled Students: 921
Faculty Details and Student Enrollment
Students and Faculty
- Total Students Enrolled: 624
- Total Full Time "Equivalent" Teachers: 33.8
- Average Student-To-Teacher Ratio: 18.5
Students Gender Breakdown
- Males: 324 (51.9%)
- Females: 300 (48.1%)
Free Lunch Student Eligibility Breakdown
- Eligible for Reduced Lunch: 13 (2.1%)
- Eligible for Free Lunch: 27 (4.3%)
- Eligible for Either Reduced or Free Lunch: 40 (6.4%)
Student Enrollment Distribution by Race / Ethnicity
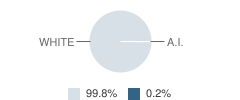
| Number | Percent | |
|---|---|---|
| American Indian | 1 | 0.2% |
| Black | - | - |
| Asian | - | - |
| Hispanic | - | - |
| White | 623 | 99.8% |
Number of Students Per Grade
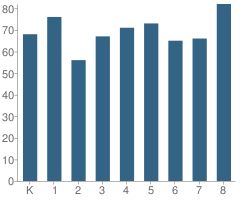
| Number | Percent | |
|---|---|---|
| Kindergarten | 68 | 10.9% |
| 1st Grade | 76 | 12.2% |
| 2nd Grade | 56 | 9.0% |
| 3rd Grade | 67 | 10.7% |
| 4th Grade | 71 | 11.4% |
| 5th Grade | 73 | 11.7% |
| 6th Grade | 65 | 10.4% |
| 7th Grade | 66 | 10.6% |
| 8th Grade | 82 | 13.1% |
Teacher Credentials & Experience (2010)
Percent of Teachers That Have at Least a Master's Degree
School:
68.9%
District:
70.3%
Percent of Teachers That Have at Least a Bachelor's Degree
School:
100.0%
District:
100.0%
Percent of Teachers That Are Properly Certified
School:
100.0%
District:
100.0%
Average Years of Teacher Experience
School:
15.0
District:
14.0
Average Teacher Salary
School:
$51,957
District:
$51,299
Source: OH Department of Education, Source: NCES 2009-2010
School Ratings and Reviews
Be The First To Review Marion Local Elementary School!
School Map and Similar Schools Nearby
Click to Activate Map of Nearby School Campuses
Private
Public
This School
Similar Schools Nearby
| Minster Elementary School PK-3 | 269 Students | 5.6 miles away |  5 out of 5 | |
| Minster Middle School 4-8 | 349 Students | 5.6 miles away | Not Yet Rated | |
| New Bremen Elementary School PK-8 | 570 Students | 5.9 miles away | Not Yet Rated | |
| Fort Loramie Elementary School PK-6 | 475 Students | 7.2 miles away | Not Yet Rated | |
| St Henry Middle School 5-8 | 315 Students | 7.6 miles away | Not Yet Rated | |
| St Henry Elementary School PK-4 | 378 Students | 7.8 miles away | Not Yet Rated | |
| Coldwater Elementary School PK-4 | 514 Students | 9.1 miles away | Not Yet Rated | |
| West Elementary School 1-6 | 459 Students | 10.3 miles away | Not Yet Rated | |
| New Knoxville Elementary School PK-8 | 319 Students | 10.7 miles away | Not Yet Rated | |
| East Elementary School KG-4 | 667 Students | 10.8 miles away | Not Yet Rated | |
Compare This School To Nearby Schools ->
School Community Forum

Join a discussion about Marion Local Elementary School and talk to others in the community including students, parents, teachers, and administrators.
Popular Discussion Topics
- Admissions and Registration Questions (e.g. Dress Code and Discipline Policy)
- School Calendar and Upcoming Events (e.g. Graduation)
- After School Programs, Extracurricular Activities, and Athletics (e.g. Football)
- News and Announcements (e.g. Yearbook and Class Supply List Details)
- Graduate and Alumni Events (e.g. Organizing Class Reunions)
Navigation
Can't Find What You Are Looking For?
Nearby Cities
Sponsored Links
K-12 Articles

The Importance of Reading for Children Preschool to Grade Three
The first teachers of children are their parents. From the time they are infants, children need to...
The first teachers of children are their parents. From the time they are infants, children need to...

The Pros and Cons of Seat Belts in School Buses
Recently the news has been full of school bus accidents where children have been seriously injured...
Recently the news has been full of school bus accidents where children have been seriously injured...

Beating the Summer Slump
"The Summer Slump", teachers call it. It happens every year. It makes its way into lesson plans...
"The Summer Slump", teachers call it. It happens every year. It makes its way into lesson plans...