Davis Middle School
Rating
Not Available
Not Available

No Reviews Yet
Find Old Friends From Davis Middle School
Use the form below to search for alumni from Davis Middle School.
School Description
School Summary and Highlights
- Enrolls 1,220 middle school students from grades 6-8
- Ranks 1983rd out of 2,050 middle schools in CA.
- 2010 Overall School AYP Met Status: No
Additional Contact Information
- Mailing Address: 621 West Poplar St., Compton, CA 90220
School Operational Details
- Title I EligibleAll students of this school are eligible for participation in authorized programs.
School District Details
- Compton Unified School District
- Per-Pupil Spending: $9,296
- Graduation Rate: 38.4%
- Dropout Rate: 12.8%
- Students Per Teacher: 18.8
- Enrolled Students: 26,531
Faculty Details and Student Enrollment
Students and Faculty
- Total Students Enrolled: 1,220
- Total Full Time "Equivalent" Teachers: 60.0
- Average Student-To-Teacher Ratio: 20.3
Students Gender Breakdown
- Males: 618 (50.7%)
- Females: 602 (49.3%)
Free Lunch Student Eligibility Breakdown
- Eligible for Reduced Lunch: 102 (8.4%)
- Eligible for Free Lunch: 957 (78.4%)
- Eligible for Either Reduced or Free Lunch: 1,059 (86.8%)
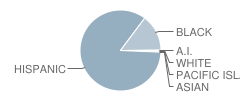
Student Enrollment Distribution by Race / Ethnicity
| Number | Percent | |
|---|---|---|
| American Indian | 1 | 0.08% |
| Black | 178 | 14.6% |
| Asian | 1 | 0.08% |
| Hispanic | 1,028 | 84.3% |
| White | 2 | 0.2% |
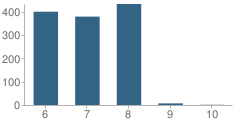
Number of Students Per Grade
| Number | Percent | |
|---|---|---|
| 6th Grade | 400 | 32.8% |
| 7th Grade | 379 | 31.1% |
| 8th Grade | 433 | 35.5% |
| 9th Grade | 7 | 0.6% |
| 10th Grade | 1 | 0.08% |
Teacher Education Background (2009)
Percent With Ph.D.
School:
1.9%
District:
13.5%
Percent With Master's Degree
School:
20.4%
District:
23.0%
Percent With Bachelor's Degree
School:
20.4%
District:
1.4%
Teacher Credentials & Experience (2009)
Percent of Teachers With Emergency Credentials: 2.1%
Percent of Teachers With Credentials: 83.0%
Number of Certificated Staff: 54.0
Average Number of Years of Teacher Experience: 10.9
Average Age
School:
39.4
District:
44.8
Source: CA Department of Education, Source: NCES 2009-2010
School Ratings and Reviews
Be The First To Review Davis Middle School!
School Map and Similar Schools Nearby
Click to Activate Map of Nearby School Campuses
Private
Public
This School
Similar Schools Nearby
| Willowbrook Middle School 6-8 | 439 Students | 1.1 miles away |  4.5 out of 5 | |
| Thurgood Marshall School KG-12 | 14 Students | 1.4 miles away |  5 out of 5 | - |
| Walton Middle School 6-8 | 569 Students | 1.4 miles away | 4.5 out of 5 | |
| Enterprise Middle School 6-8 | 603 Students | 1.4 miles away | 5 out of 5 | |
| Bunche Middle School 6-8 | 797 Students | 1.5 miles away | 5 out of 5 | |
| Roosevelt Middle School 6-8 | 1,153 Students | 1.6 miles away | 5 out of 5 | |
| Avalon Gardens Elementary School KG-6 | 218 Students | 2.0 miles away | Not Yet Rated | |
| Vanguard Learning Center School 4-8 | 407 Students | 2.2 miles away | 5 out of 5 | |
| Whaley Middle School 6-8 | 950 Students | 2.6 miles away |  4 out of 5 | |
| Edwin Markham Middle School 6-8 | 1,263 Students | 2.9 miles away | Not Yet Rated | |
Compare This School To Nearby Schools ->
School Community Forum

Join a discussion about Davis Middle School and talk to others in the community including students, parents, teachers, and administrators.
Popular Discussion Topics
- Admissions and Registration Questions (e.g. Dress Code and Discipline Policy)
- School Calendar and Upcoming Events (e.g. Graduation)
- After School Programs, Extracurricular Activities, and Athletics (e.g. Football)
- News and Announcements (e.g. Yearbook and Class Supply List Details)
- Graduate and Alumni Events (e.g. Organizing Class Reunions)
Navigation
Can't Find What You Are Looking For?
Rankings
Nearby Cities
Sponsored Links
K-12 Articles

National Memories
Few events are seared into our memory, and bring the country together-not as Democrat and...
Few events are seared into our memory, and bring the country together-not as Democrat and...

Help Your High School Student Create an Impressive Resume
Time has flown. Your teen is in high school and has demonstrated an interest in obtaining a part...
Time has flown. Your teen is in high school and has demonstrated an interest in obtaining a part...

Summer Reading
In 1998, a book was published in the US that turned a hatred of reading to love. “Harry Potter and...
In 1998, a book was published in the US that turned a hatred of reading to love. “Harry Potter and...