Westlake High School
100 North Lakeview Canyon Rd, Westlake Village, CA 91362 | (805) 497-6711
- Grades: 9-12
- Student Enrollment: 2,390

No Reviews Yet
Find Old Friends From Westlake High School
Use the form below to search for alumni from Westlake High School.
School Description
School Summary and Highlights
- Enrolls 2,390 high school students from grades 9-12
- Ranks 85th out of 1,197 high schools in CA.
- 2010 Overall School AYP Met Status: Yes
- National Blue Ribbon Schools Award 2004

Additional Contact Information
- Mailing Address: 100 North Lakeview Canyon Rd., Westlake Village, CA 91362
School District Details
- Conejo Valley Unified School District
- Per-Pupil Spending: $8,471
- Graduation Rate: 97.6%
- Dropout Rate: 1.1%
- Students Per Teacher: 23.0
- Enrolled Students: 21,184
Faculty Details and Student Enrollment
Students and Faculty
- Total Students Enrolled: 2,390
- Total Full Time "Equivalent" Teachers: 94.8
- Average Student-To-Teacher Ratio: 25.2
Students Gender Breakdown
- Males: 1,260 (52.7%)
- Females: 1,130 (47.3%)
Free Lunch Student Eligibility Breakdown
- Eligible for Reduced Lunch: 64 (2.7%)
- Eligible for Free Lunch: 170 (7.1%)
- Eligible for Either Reduced or Free Lunch: 234 (9.8%)
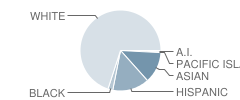
Student Enrollment Distribution by Race / Ethnicity

| Number | Percent | |
|---|---|---|
| American Indian | 15 | 0.6% |
| Black | 49 | 2.1% |
| Asian | 299 | 12.5% |
| Hispanic | 349 | 14.6% |
| White | 1,650 | 69.0% |
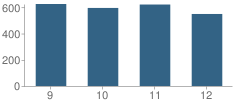
Number of Students Per Grade

| Number | Percent | |
|---|---|---|
| 9th Grade | 625 | 26.2% |
| 10th Grade | 595 | 24.9% |
| 11th Grade | 621 | 26.0% |
| 12th Grade | 549 | 23.0% |
Graduates Information (2010)
Graduation Rate
School:
96.4%
District:
94.0%
State:
78.6%
Teacher Education Background (2009)
Percent With Ph.D.
School:
2.0%
District:
1.2%
Percent With Master's Degree
School:
36.6%
District:
45.2%
Percent With Bachelor's Degree
School:
5.0%
District:
3.6%
Teacher Credentials & Experience (2009)
Percent of Teachers With Credentials: 96.7%
Number of Certificated Staff: 101.0
Average Number of Years of Teacher Experience: 12.2
Average Age
School:
42.1
District:
50.0
Source: CA Department of Education, Source: NCES 2009-2010
School Ratings and Reviews
Be The First To Review Westlake High School!
Sponsored Links
Test Scores and Performance Information
Overall School Rating
How is this determined?
The overall school rating shows that Westlake High School performed on average much better than most other schools across the state on CST state exams in the following subjects:
- CST Algebra I
- CST Algebra II
- CST Biology
- CST Chemistry
- CST Earth Science
- CST English-Language Arts
- CST General Mathematics
- CST Geometry
- CST Physics
- CST Science
- CST Summative High School Math
- CST U.S. History
- CST World History
AYP Results (2010)
Overall AYP Met: Yes
ELA AYP Met: Yes
Math AYP Met: Yes
ACT Exam Results (2009)
Percent of Students Taking ACT Exam: 33.0%
Average Combined Score: 25.8
Percent Scoring At or Above 21: 89.0%
SAT Exam Results (2009)
Percent of Students Taking SAT Exam: 59.0%
Average Combined Score: 1,749.9
Critical Reading Average: 571.2
Math Average: 593.8
Writing Average: 584.8
Percent Scoring At or Above 1500: 80.7%
CST - Test Proficiency by Grade and Subject
Grade 9 - % of students at or above proficiency
| School | District | State | |
|---|---|---|---|
| CST Algebra I Test | |||
| 2010 | 38.0% | 36.0% | 22.0% |
| 2009 | 27.0% | 29.0% | 21.0% |
| 2008 | 33.0% | 21.0% | 18.0% |
| CST Algebra II Test | |||
| 2010 | 94.0% | 99.0% | 69.0% |
| CST Biology Test | |||
| 2010 | 72.0% | 77.0% | 55.0% |
| 2009 | 66.0% | 72.0% | 51.0% |
| 2008 | 65.0% | 70.0% | 52.0% |
| CST English-Language Arts Test | |||
| 2010 | 82.0% | 80.0% | 54.0% |
| 2009 | 77.0% | 76.0% | 50.0% |
| 2008 | 74.0% | 74.0% | 49.0% |
| CST General Mathematics Test | |||
| 2010 | 14.0% | 25.0% | 17.0% |
| 2009 | 19.0% | 23.0% | 17.0% |
| 2008 | 20.0% | 26.0% | 18.0% |
| CST Geometry Test | |||
| 2010 | 77.0% | 70.0% | 46.0% |
| 2009 | 72.0% | 65.0% | 47.0% |
| 2008 | 67.0% | 58.0% | 43.0% |
| CST World History Test | |||
| 2008 | 22.0% | 18.0% | 36.0% |
Grade 10 - % of students at or above proficiency
| School | District | State | |
|---|---|---|---|
| CST Algebra I Test | |||
| 2010 | 18.0% | 16.0% | 12.0% |
| 2009 | 18.0% | 20.0% | 11.0% |
| 2008 | 12.0% | 15.0% | 9.0% |
| CST Algebra II Test | |||
| 2010 | 72.0% | 55.0% | 40.0% |
| 2009 | 62.0% | 50.0% | 37.0% |
| 2008 | 42.0% | 40.0% | 36.0% |
| CST Biology Test | |||
| 2010 | 33.0% | 66.0% | 38.0% |
| 2009 | 44.0% | 66.0% | 34.0% |
| 2008 | 56.0% | 66.0% | 35.0% |
| CST Chemistry Test | |||
| 2010 | 82.0% | 85.0% | 47.0% |
| 2009 | 65.0% | 72.0% | 44.0% |
| 2008 | 78.0% | 82.0% | 41.0% |
| CST Earth Science Test | |||
| 2010 | 50.0% | 50.0% | 29.0% |
| 2009 | 42.0% | 37.0% | 23.0% |
| CST English-Language Arts Test | |||
| 2010 | 82.0% | 76.0% | 45.0% |
| 2009 | 73.0% | 69.0% | 44.0% |
| 2008 | 74.0% | 69.0% | 41.0% |
| CST Geometry Test | |||
| 2010 | 19.0% | 17.0% | 14.0% |
| 2009 | 29.0% | 18.0% | 14.0% |
| 2008 | 19.0% | 13.0% | 12.0% |
| CST Science Test | |||
| 2010 | 76.0% | 76.0% | 46.0% |
| 2009 | 69.0% | 72.0% | 44.0% |
| 2008 | 72.0% | 71.0% | 40.0% |
| CST Summative High School Math Test | |||
| 2010 | 91.0% | 96.0% | 75.0% |
| 2009 | - | - | - |
| 2008 | 100.0% | 93.0% | 68.0% |
| CST World History Test | |||
| 2010 | 81.0% | 74.0% | 42.0% |
| 2009 | 66.0% | 64.0% | 38.0% |
| 2008 | 61.0% | 60.0% | 33.0% |
Grade 11 - % of students at or above proficiency
| School | District | State | |
|---|---|---|---|
| CST Algebra I Test | |||
| 2010 | 18.0% | 11.0% | 8.0% |
| 2009 | 4.0% | 8.0% | 8.0% |
| 2008 | 6.0% | 5.0% | 5.0% |
| CST Algebra II Test | |||
| 2010 | 28.0% | 17.0% | 14.0% |
| 2009 | 12.0% | 8.0% | 12.0% |
| 2008 | 10.0% | 8.0% | 11.0% |
| CST Biology Test | |||
| 2010 | 91.0% | 73.0% | 46.0% |
| 2009 | 96.0% | 79.0% | 41.0% |
| 2008 | 82.0% | 68.0% | 39.0% |
| CST Chemistry Test | |||
| 2010 | 55.0% | 58.0% | 30.0% |
| 2009 | 42.0% | 52.0% | 27.0% |
| 2008 | 29.0% | 41.0% | 25.0% |
| CST Earth Science Test | |||
| 2010 | 71.0% | 53.0% | 32.0% |
| 2009 | 23.0% | 16.0% | 26.0% |
| CST English-Language Arts Test | |||
| 2010 | 79.0% | 70.0% | 42.0% |
| 2009 | 70.0% | 65.0% | 40.0% |
| 2008 | 68.0% | 62.0% | 37.0% |
| CST Geometry Test | |||
| 2010 | 18.0% | 9.0% | 6.0% |
| 2009 | 9.0% | 8.0% | 7.0% |
| 2008 | 12.0% | 6.0% | 6.0% |
| CST Physics Test | |||
| 2010 | 78.0% | 91.0% | 53.0% |
| 2009 | 97.0% | 96.0% | 50.0% |
| 2008 | 75.0% | 89.0% | 47.0% |
| CST Summative High School Math Test | |||
| 2010 | 70.0% | 63.0% | 50.0% |
| 2009 | 56.0% | 56.0% | 47.0% |
| 2008 | 52.0% | 45.0% | 43.0% |
| CST U.S. History Test | |||
| 2010 | 76.0% | 71.0% | 45.0% |
| 2009 | 70.0% | 68.0% | 44.0% |
| 2008 | 64.0% | 61.0% | 38.0% |
| CST World History Test | |||
| 2010 | 27.0% | 23.0% | 15.0% |
| 2009 | - | - | - |
| 2008 | 4.0% | 15.0% | 9.0% |
End of Course - % of students at or above proficiency
| School | District | State | |
|---|---|---|---|
| CST Algebra I Test | |||
| 2010 | 30.0% | 60.0% | 31.0% |
| 2009 | 21.0% | 65.0% | 28.0% |
| 2008 | 24.0% | 56.0% | 25.0% |
| CST Algebra II Test | |||
| 2010 | 61.0% | 47.0% | 31.0% |
| 2009 | 50.0% | 40.0% | 28.0% |
| 2008 | 32.0% | 31.0% | 27.0% |
| CST Biology Test | |||
| 2010 | 72.0% | 71.0% | 46.0% |
| 2009 | 70.0% | 70.0% | 42.0% |
| 2008 | 64.0% | 68.0% | 42.0% |
| CST Chemistry Test | |||
| 2010 | 76.0% | 74.0% | 38.0% |
| 2009 | 56.0% | 64.0% | 36.0% |
| 2008 | 52.0% | 59.0% | 32.0% |
| CST Earth Science Test | |||
| 2010 | 51.0% | 61.0% | 33.0% |
| 2009 | 41.0% | 51.0% | 28.0% |
| CST General Mathematics Test | |||
| 2010 | 14.0% | 38.0% | 27.0% |
| 2009 | 19.0% | 32.0% | 26.0% |
| 2008 | 20.0% | 35.0% | 27.0% |
| CST Geometry Test | |||
| 2010 | 55.0% | 51.0% | 27.0% |
| 2009 | 55.0% | 48.0% | 26.0% |
| 2008 | 47.0% | 41.0% | 24.0% |
| CST Physics Test | |||
| 2010 | 78.0% | 91.0% | 49.0% |
| 2009 | 97.0% | 96.0% | 46.0% |
| 2008 | 76.0% | 89.0% | 43.0% |
| CST Summative High School Math Test | |||
| 2010 | 70.0% | 65.0% | 54.0% |
| 2009 | 57.0% | 58.0% | 50.0% |
| 2008 | 54.0% | 49.0% | 47.0% |
| CST World History Test | |||
| 2010 | 80.0% | 72.0% | 41.0% |
| 2009 | 65.0% | 63.0% | 38.0% |
| 2008 | 59.0% | 58.0% | 33.0% |
Source: CA Department of Education 2009-2010
School Map and Similar Schools Nearby
Click to Activate Map of Nearby School Campuses
Private
Public
This School
Similar Schools Nearby
| Oak Park High School 9-12 | 1,307 Students | 3.4 miles away | Not Yet Rated | |
| Agoura High School 9-12 | 2,161 Students | 4.0 miles away | Not Yet Rated | |
| Thousand Oaks High School 9-12 | 2,526 Students | 4.6 miles away | Not Yet Rated | |
| Newbury Park High School 9-12 | 2,587 Students | 8.0 miles away | Not Yet Rated | |
| El Camino Real High School 9-12 | 3,513 Students | 10.0 miles away | ![]() 5 out of 5 | |
| Calabasas High School 9-12 | 1,981 Students | 11.2 miles away | Not Yet Rated | |
| Canoga Park High School 9-12 | 1,860 Students | 12.4 miles away | ![]() 5 out of 5 | |
| William Howard Taft High School 9-12 | 2,749 Students | 14.1 miles away | ![]() 5 out of 5 | |
| Chatsworth High School 9-12 | 3,129 Students | 14.8 miles away | ![]() 5 out of 5 | |
| Grover Cleveland High School 9-12 | 3,861 Students | 15.9 miles away | Not Yet Rated | |
Compare This School To Nearby Schools ->
School Community Forum

Join a discussion about Westlake High School and talk to others in the community including students, parents, teachers, and administrators.
Popular Discussion Topics
- Admissions and Registration Questions (e.g. Dress Code and Discipline Policy)
- School Calendar and Upcoming Events (e.g. Graduation)
- After School Programs, Extracurricular Activities, and Athletics (e.g. Football)
- News and Announcements (e.g. Yearbook and Class Supply List Details)
- Graduate and Alumni Events (e.g. Organizing Class Reunions)
Navigation
Can't Find What You Are Looking For?
Rankings
Nearby Cities
Sponsored Links
K-12 Articles
Attend Your Teen's Holiday Parties
Christmas and New Years are coming, and with them Christmas and New Years Eve parties. At many of...
Beating the Summer Slump
"The Summer Slump", teachers call it. It happens every year. It makes its way into lesson plans...
Idle Hands
The worst affliction affecting our kids today is not teen pregnancy, drugs and alcohol, or...

