Northview High School

No Reviews Yet
Find Old Friends From Northview High School
Use the form below to search for alumni from Northview High School.
School Description
School Summary and Highlights
- Enrolls 1,625 high school students from grades 9-12
- Ranks 657th out of 1,197 high schools in CA.
- 2010 Overall School AYP Met Status: No
Additional Contact Information
- Mailing Address: 1016 West Cypress Ave., Covina, CA 91722
School District Details
- Covina-Valley Unified School District
- Per-Pupil Spending: $8,522
- Graduation Rate: 86.7%
- Dropout Rate: 2.2%
- Students Per Teacher: 24.0
- Enrolled Students: 13,998
Faculty Details and Student Enrollment
Students and Faculty
- Total Students Enrolled: 1,625
- Total Full Time "Equivalent" Teachers: 62.0
- Average Student-To-Teacher Ratio: 26.2
Students Gender Breakdown
- Males: 803 (49.4%)
- Females: 822 (50.6%)
Free Lunch Student Eligibility Breakdown
- Eligible for Reduced Lunch: 243 (15.0%)
- Eligible for Free Lunch: 777 (47.8%)
- Eligible for Either Reduced or Free Lunch: 1,020 (62.8%)
Student Enrollment Distribution by Race / Ethnicity
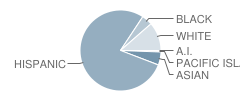
| Number | Percent | |
|---|---|---|
| American Indian | 7 | 0.4% |
| Black | 71 | 4.4% |
| Asian | 86 | 5.3% |
| Hispanic | 1,266 | 77.9% |
| White | 186 | 11.4% |
Number of Students Per Grade

| Number | Percent | |
|---|---|---|
| 9th Grade | 463 | 28.5% |
| 10th Grade | 387 | 23.8% |
| 11th Grade | 422 | 26.0% |
| 12th Grade | 353 | 21.7% |
Graduates Information (2010)
Graduation Rate
School:
91.9%
District:
90.4%
State:
78.6%
Teacher Education Background (2009)
Percent With Master's Degree: 15.9%
Percent With Bachelor's Degree: 17.4%
Teacher Credentials & Experience (2009)
Percent of Teachers With Emergency Credentials: 4.8%
Percent of Teachers With Credentials: 93.5%
Number of Certificated Staff: 69.0
Average Number of Years of Teacher Experience: 9.1
Average Age: 37.7
Source: CA Department of Education, Source: NCES 2009-2010
School Ratings and Reviews
Be The First To Review Northview High School!
Sponsored Links
Test Scores and Performance Information
Overall School Rating
How is this determined?
The overall school rating shows that Northview High School performed on average about the same as other schools across the state on CST state exams in the following subjects:
- CST Algebra I
- CST Algebra II
- CST Biology
- CST Chemistry
- CST Earth Science
- CST English-Language Arts
- CST General Mathematics
- CST Geometry
- CST Physics
- CST Science
- CST Summative High School Math
- CST U.S. History
- CST World History
AYP Results (2010)
Overall AYP Met: No
ELA AYP Met: No
Math AYP Met: Yes
ACT Exam Results (2009)
Percent of Students Taking ACT Exam: 18.6%
Average Combined Score: 18.8
Percent Scoring At or Above 21: 31.1%
SAT Exam Results (2009)
Percent of Students Taking SAT Exam: 36.4%
Average Combined Score: 1,303.1
Critical Reading Average: 435.7
Math Average: 442.8
Writing Average: 424.6
Percent Scoring At or Above 1500: 22.1%
CST - Test Proficiency by Grade and Subject
Grade 9 - % of students at or above proficiency
| School | District | State | |
|---|---|---|---|
| CST Algebra I Test | |||
| 2010 | 26.0% | 20.0% | 22.0% |
| 2009 | 50.0% | 25.0% | 21.0% |
| 2008 | 23.0% | 12.0% | 18.0% |
| CST Algebra II Test | |||
| 2010 | 83.0% | 71.0% | 69.0% |
| 2009 | 65.0% | 62.0% | 65.0% |
| 2008 | 26.0% | 57.0% | 66.0% |
| CST Biology Test | |||
| 2010 | 50.0% | 61.0% | 55.0% |
| 2009 | 73.0% | 78.0% | 51.0% |
| 2008 | 55.0% | 67.0% | 52.0% |
| CST Earth Science Test | |||
| 2010 | 43.0% | 45.0% | 35.0% |
| 2009 | 23.0% | 34.0% | 29.0% |
| 2008 | 41.0% | 41.0% | 31.0% |
| CST English-Language Arts Test | |||
| 2010 | 60.0% | 65.0% | 54.0% |
| 2009 | 50.0% | 54.0% | 50.0% |
| 2008 | 47.0% | 54.0% | 49.0% |
| CST General Mathematics Test | |||
| 2010 | 24.0% | 20.0% | 17.0% |
| 2009 | 37.0% | 29.0% | 17.0% |
| 2008 | 35.0% | 32.0% | 18.0% |
| CST Geometry Test | |||
| 2010 | 18.0% | 28.0% | 46.0% |
| 2009 | 49.0% | 36.0% | 47.0% |
| 2008 | 33.0% | 29.0% | 43.0% |
| CST World History Test | |||
| 2010 | 49.0% | 53.0% | 45.0% |
| 2009 | 65.0% | 66.0% | 41.0% |
| 2008 | 54.0% | 54.0% | 36.0% |
Grade 10 - % of students at or above proficiency
| School | District | State | |
|---|---|---|---|
| CST Algebra I Test | |||
| 2010 | 22.0% | 19.0% | 12.0% |
| 2009 | 23.0% | 21.0% | 11.0% |
| 2008 | 6.0% | 11.0% | 9.0% |
| CST Algebra II Test | |||
| 2010 | 37.0% | 22.0% | 40.0% |
| 2009 | 18.0% | 21.0% | 37.0% |
| 2008 | 28.0% | 24.0% | 36.0% |
| CST Biology Test | |||
| 2010 | 28.0% | 42.0% | 38.0% |
| 2009 | 32.0% | 40.0% | 34.0% |
| 2008 | 25.0% | 38.0% | 35.0% |
| CST Chemistry Test | |||
| 2010 | 33.0% | 34.0% | 47.0% |
| 2009 | 26.0% | 27.0% | 44.0% |
| 2008 | 19.0% | 22.0% | 41.0% |
| CST Earth Science Test | |||
| 2010 | 18.0% | 19.0% | 29.0% |
| 2009 | 27.0% | 23.0% | 23.0% |
| 2008 | 16.0% | 14.0% | 23.0% |
| CST English-Language Arts Test | |||
| 2010 | 43.0% | 47.0% | 45.0% |
| 2009 | 42.0% | 44.0% | 44.0% |
| 2008 | 35.0% | 42.0% | 41.0% |
| CST Geometry Test | |||
| 2010 | 3.0% | 8.0% | 14.0% |
| 2009 | 13.0% | 12.0% | 14.0% |
| 2008 | 9.0% | 10.0% | 12.0% |
| CST Science Test | |||
| 2010 | 43.0% | 49.0% | 46.0% |
| 2009 | 42.0% | 45.0% | 44.0% |
| 2008 | 32.0% | 42.0% | 40.0% |
| CST Summative High School Math Test | |||
| 2010 | 64.0% | 62.0% | 75.0% |
| 2009 | 39.0% | 61.0% | 71.0% |
| 2008 | 43.0% | 49.0% | 68.0% |
| CST World History Test | |||
| 2010 | 38.0% | 40.0% | 42.0% |
| 2009 | 39.0% | 39.0% | 38.0% |
| 2008 | 24.0% | 30.0% | 33.0% |
| CST Physics Test | |||
| 2008 | 13.0% | 13.0% | 36.0% |
Grade 11 - % of students at or above proficiency
| School | District | State | |
|---|---|---|---|
| CST Algebra I Test | |||
| 2010 | 6.0% | 4.0% | 8.0% |
| 2009 | 3.0% | 9.0% | 8.0% |
| 2008 | 4.0% | 7.0% | 5.0% |
| CST Algebra II Test | |||
| 2010 | 19.0% | 11.0% | 14.0% |
| 2009 | 12.0% | 10.0% | 12.0% |
| 2008 | 9.0% | 8.0% | 11.0% |
| CST Biology Test | |||
| 2010 | 30.0% | 28.0% | 46.0% |
| 2009 | 46.0% | 37.0% | 41.0% |
| 2008 | 48.0% | 41.0% | 39.0% |
| CST Chemistry Test | |||
| 2010 | 13.0% | 27.0% | 30.0% |
| 2009 | 15.0% | 26.0% | 27.0% |
| 2008 | 6.0% | 26.0% | 25.0% |
| CST Earth Science Test | |||
| 2010 | 36.0% | 31.0% | 32.0% |
| 2009 | 22.0% | 22.0% | 26.0% |
| 2008 | 16.0% | 21.0% | 28.0% |
| CST English-Language Arts Test | |||
| 2010 | 41.0% | 41.0% | 42.0% |
| 2009 | 36.0% | 40.0% | 40.0% |
| 2008 | 31.0% | 38.0% | 37.0% |
| CST Geometry Test | |||
| 2010 | 3.0% | 3.0% | 6.0% |
| 2009 | 6.0% | 7.0% | 7.0% |
| 2008 | 5.0% | 5.0% | 6.0% |
| CST Physics Test | |||
| 2010 | 31.0% | 36.0% | 53.0% |
| 2009 | 19.0% | 27.0% | 50.0% |
| 2008 | 12.0% | 26.0% | 47.0% |
| CST Summative High School Math Test | |||
| 2010 | 38.0% | 46.0% | 50.0% |
| 2009 | 29.0% | 38.0% | 47.0% |
| 2008 | 29.0% | 34.0% | 43.0% |
| CST U.S. History Test | |||
| 2010 | 49.0% | 43.0% | 45.0% |
| 2009 | 44.0% | 44.0% | 44.0% |
| 2008 | 37.0% | 39.0% | 38.0% |
End of Course - % of students at or above proficiency
| School | District | State | |
|---|---|---|---|
| CST Algebra I Test | |||
| 2010 | 22.0% | 28.0% | 31.0% |
| 2009 | 28.0% | 29.0% | 28.0% |
| 2008 | 10.0% | 24.0% | 25.0% |
| CST Algebra II Test | |||
| 2010 | 35.0% | 24.0% | 31.0% |
| 2009 | 23.0% | 25.0% | 28.0% |
| 2008 | 17.0% | 22.0% | 27.0% |
| CST Biology Test | |||
| 2010 | 39.0% | 45.0% | 46.0% |
| 2009 | 46.0% | 47.0% | 42.0% |
| 2008 | 38.0% | 43.0% | 42.0% |
| CST Chemistry Test | |||
| 2010 | 24.0% | 28.0% | 38.0% |
| 2009 | 23.0% | 26.0% | 36.0% |
| 2008 | 15.0% | 25.0% | 32.0% |
| CST Earth Science Test | |||
| 2010 | 39.0% | 43.0% | 33.0% |
| 2009 | 23.0% | 31.0% | 28.0% |
| 2008 | 32.0% | 35.0% | 28.0% |
| CST General Mathematics Test | |||
| 2010 | 24.0% | 23.0% | 27.0% |
| 2009 | 37.0% | 26.0% | 26.0% |
| 2008 | 35.0% | 31.0% | 27.0% |
| CST Geometry Test | |||
| 2010 | 8.0% | 22.0% | 27.0% |
| 2009 | 19.0% | 25.0% | 26.0% |
| 2008 | 13.0% | 22.0% | 24.0% |
| CST Physics Test | |||
| 2010 | 32.0% | 36.0% | 49.0% |
| 2009 | 20.0% | 27.0% | 46.0% |
| 2008 | 12.0% | 24.0% | 43.0% |
| CST Summative High School Math Test | |||
| 2010 | 46.0% | 50.0% | 54.0% |
| 2009 | 31.0% | 44.0% | 50.0% |
| 2008 | 33.0% | 39.0% | 47.0% |
| CST World History Test | |||
| 2010 | 40.0% | 40.0% | 41.0% |
| 2009 | 44.0% | 40.0% | 38.0% |
| 2008 | 28.0% | 31.0% | 33.0% |
Source: CA Department of Education 2009-2010
School Map and Similar Schools Nearby
Click to Activate Map of Nearby School Campuses
Private
Public
This School
Similar Schools Nearby
| Gladstone High School 9-12 | 1,565 Students | 0.8 miles away | Not Yet Rated | |
| Covina High School 9-12 | 1,506 Students | 1.1 miles away | Not Yet Rated | |
| South Hills High School 9-12 | 2,067 Students | 2.0 miles away | ![]() 5 out of 5 | |
| West Covina High School 9-12 | 2,914 Students | 2.2 miles away | ![]() 4 out of 5 | |
| Azusa High School 9-12 | 1,464 Students | 2.2 miles away | ![]() 3.5 out of 5 | |
| Charter Oak High School 9-12 | 1,995 Students | 2.9 miles away | ![]() 5 out of 5 | |
| Sandburg Middle School 6-9 | 751 Students | 3.7 miles away | Not Yet Rated | |
| Duarte High School 9-12 | 1,173 Students | 4.5 miles away | ![]() 5 out of 5 | |
| Bassett High School 9-12 | 1,294 Students | 4.8 miles away | ![]() 3.5 out of 5 | |
| William Workman High School 9-12 | 1,202 Students | 4.8 miles away | ![]() 4 out of 5 | |
Compare This School To Nearby Schools ->
School Community Forum

Join a discussion about Northview High School and talk to others in the community including students, parents, teachers, and administrators.
Popular Discussion Topics
- Admissions and Registration Questions (e.g. Dress Code and Discipline Policy)
- School Calendar and Upcoming Events (e.g. Graduation)
- After School Programs, Extracurricular Activities, and Athletics (e.g. Football)
- News and Announcements (e.g. Yearbook and Class Supply List Details)
- Graduate and Alumni Events (e.g. Organizing Class Reunions)
Navigation
Can't Find What You Are Looking For?
Rankings
Nearby Cities
Sponsored Links
K-12 Articles
Attend Your Teen's Holiday Parties
Christmas and New Years are coming, and with them Christmas and New Years Eve parties. At many of...
Teaching Your Child Study Skills
Many children who have the capability to get good grades experience frustration because of low...
Helping Young Children with Printing and Cursive Writing
Is your child experiencing difficulty printing or writing? Is he unable to print or write legibly,...


