Culver City Middle School
Rating
Not Available
Not Available

No Reviews Yet
Find Old Friends From Culver City Middle School
Use the form below to search for alumni from Culver City Middle School.
School Description
School Summary and Highlights
- Enrolls 1,567 middle school students from grades 6-8
- Ranks 566th out of 2,050 middle schools in CA.
- 2010 Overall School AYP Met Status: No
Additional Contact Information
- Mailing Address: 4601 Elenda St., Culver City, CA 90230
School Operational Details
- Title I Eligible
School District Details
- Culver City Unified School District
- Per-Pupil Spending: $8,919
- Graduation Rate: 78.7%
- Dropout Rate: 2.6%
- Students Per Teacher: 23.3
- Enrolled Students: 6,763
Faculty Details and Student Enrollment
Students and Faculty
- Total Students Enrolled: 1,567
- Total Full Time "Equivalent" Teachers: 62.0
- Average Student-To-Teacher Ratio: 25.3
Students Gender Breakdown
- Males: 753 (48.1%)
- Females: 814 (51.9%)
Free Lunch Student Eligibility Breakdown
- Eligible for Reduced Lunch: 185 (11.8%)
- Eligible for Free Lunch: 468 (29.9%)
- Eligible for Either Reduced or Free Lunch: 653 (41.7%)
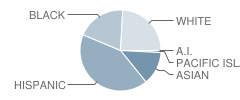
Student Enrollment Distribution by Race / Ethnicity
| Number | Percent | |
|---|---|---|
| American Indian | 3 | 0.2% |
| Black | 306 | 19.5% |
| Asian | 209 | 13.3% |
| Hispanic | 658 | 42.0% |
| White | 377 | 24.1% |
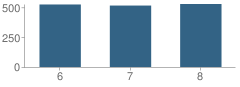
Number of Students Per Grade
| Number | Percent | |
|---|---|---|
| 6th Grade | 524 | 33.4% |
| 7th Grade | 515 | 32.9% |
| 8th Grade | 528 | 33.7% |
Teacher Education Background (2009)
Percent With Ph.D.
School:
1.3%
District:
7.1%
Percent With Master's Degree
School:
23.7%
District:
42.9%
Percent With Bachelor's Degree
School:
5.3%
District:
3.6%
Teacher Credentials & Experience (2009)
Percent of Teachers With Credentials: 100.0%
Number of Certificated Staff: 76.0
Average Number of Years of Teacher Experience: 12.6
Average Age
School:
42.7
District:
45.2
Source: CA Department of Education, Source: NCES 2009-2010
School Ratings and Reviews
Be The First To Review Culver City Middle School!
School Map and Similar Schools Nearby
Click to Activate Map of Nearby School Campuses
Private
Public
This School
Similar Schools Nearby
| Palms Middle School 6-8 | 1,699 Students | 1.5 miles away |  5 out of 5 | |
| Marina Del Rey Middle School 6-8 | 823 Students | 1.8 miles away | Not Yet Rated | |
| Short Avenue Elementary School KG-6 | 364 Students | 2.1 miles away | Not Yet Rated | |
| Frank D. Parent Elementary School KG-8 | 803 Students | 2.3 miles away | Not Yet Rated | |
| Daniel Webster Middle School 6-8 | 802 Students | 2.5 miles away | 5 out of 5 | |
| La Tijera School KG-8 | 418 Students | 2.6 miles away |  4 out of 5 | |
| Orville Wright Middle School 6-8 | 975 Students | 2.6 miles away | Not Yet Rated | |
| Richland Avenue Elementary School KG-6 | 248 Students | 2.7 miles away | 5 out of 5 | |
| Mark Twain Middle School 6-8 | 759 Students | 2.8 miles away | 5 out of 5 | |
| Broadway Elementary School KG-6 | 259 Students | 3.5 miles away | 5 out of 5 | |
Compare This School To Nearby Schools ->
School Community Forum

Join a discussion about Culver City Middle School and talk to others in the community including students, parents, teachers, and administrators.
Popular Discussion Topics
- Admissions and Registration Questions (e.g. Dress Code and Discipline Policy)
- School Calendar and Upcoming Events (e.g. Graduation)
- After School Programs, Extracurricular Activities, and Athletics (e.g. Football)
- News and Announcements (e.g. Yearbook and Class Supply List Details)
- Graduate and Alumni Events (e.g. Organizing Class Reunions)
Navigation
Can't Find What You Are Looking For?
Rankings
Nearby Cities
Sponsored Links
K-12 Articles

Exciting School Lunch Ideas
Earlier this week I had reason to drop by my grandsons’ school at lunch time. While waiting for the...
Earlier this week I had reason to drop by my grandsons’ school at lunch time. While waiting for the...

Information on Cyberbullying
What is Cyberbullying? Cyberbullying is a new form of harassment, emotional abuse,...
What is Cyberbullying? Cyberbullying is a new form of harassment, emotional abuse,...

Teaching Kids to Deal with Peer Pressure
Parents usually become very concerned when they hear the term “peer pressure.” However, peer...
Parents usually become very concerned when they hear the term “peer pressure.” However, peer...