Orosi High School

1 out of 5 | 1 Review
Find Old Friends From Orosi High School
Use the form below to search for alumni from Orosi High School.
School Description
School Summary and Highlights
- Enrolls 1,000 high school students from grades 9-12
- Ranks 1119th out of 1,197 high schools in CA.
- 2010 Overall School AYP Met Status: No
Additional Contact Information
- Mailing Address: 41815 Road 128, Orosi, CA 93647
School Operational Details
- Title I EligibleAll students of this school are eligible for participation in authorized programs.
School District Details
- Cutler-Orosi Joint Unified School District
- Per-Pupil Spending: $9,047
- Graduation Rate: 77.6%
- Dropout Rate: 3.8%
- Students Per Teacher: 18.7
- Enrolled Students: 4,162
Faculty Details and Student Enrollment
Students and Faculty
- Total Students Enrolled: 1,000
- Total Full Time "Equivalent" Teachers: 46.0
- Average Student-To-Teacher Ratio: 21.7
Students Gender Breakdown
- Males: 519 (51.9%)
- Females: 481 (48.1%)
Free Lunch Student Eligibility Breakdown
- Eligible for Reduced Lunch: - (-)
- Eligible for Free Lunch: 974 (97.4%)
- Eligible for Either Reduced or Free Lunch: 974 (97.4%)
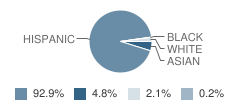
Student Enrollment Distribution by Race / Ethnicity

| Number | Percent | |
|---|---|---|
| American Indian | - | - |
| Black | 2 | 0.2% |
| Asian | 48 | 4.8% |
| Hispanic | 929 | 92.9% |
| White | 21 | 2.1% |
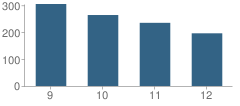
Number of Students Per Grade

| Number | Percent | |
|---|---|---|
| 9th Grade | 305 | 30.5% |
| 10th Grade | 264 | 26.4% |
| 11th Grade | 235 | 23.5% |
| 12th Grade | 196 | 19.6% |
Graduates Information (2010)
Graduation Rate
School:
80.8%
District:
69.9%
State:
78.6%
Teacher Education Background (2009)
Percent With Master's Degree
School:
22.0%
District:
25.0%
Percent With Bachelor's Degree: 6.0%
Teacher Credentials & Experience (2009)
Percent of Teachers With Credentials: 97.8%
Number of Certificated Staff: 50.0
Average Number of Years of Teacher Experience: 14.2
Average Age
School:
42.6
District:
45.3
Source: CA Department of Education, Source: NCES 2009-2010
Sponsored Links
Test Scores and Performance Information
Overall School Rating
How is this determined?
The overall school rating shows that Orosi High School performed on average much worse than most other schools across the state on CST state exams in the following subjects:
- CST Algebra I
- CST Algebra II
- CST Biology
- CST Chemistry
- CST Earth Science
- CST English-Language Arts
- CST General Mathematics
- CST Geometry
- CST Science
- CST Summative High School Math
- CST U.S. History
- CST World History
AYP Results (2010)
Overall AYP Met: No
ELA AYP Met: No
Math AYP Met: No
Program Improvement (PI) Requirement Under NCLB (2010)
First Year PI Requirement was Implemented: 1997-1998
School's Placement Under NCLB: Year 5
ACT Exam Results (2009)
Percent of Students Taking ACT Exam: 19.5%
Average Combined Score: 15.8
Percent Scoring At or Above 21: 5.9%
SAT Exam Results (2009)
Percent of Students Taking SAT Exam: 37.9%
Average Combined Score: 1,127.3
Critical Reading Average: 373.9
Math Average: 377.4
Writing Average: 375.9
Percent Scoring At or Above 1500: 4.6%
CST - Test Proficiency by Grade and Subject
Grade 9 - % of students at or above proficiency
| School | District | State | |
|---|---|---|---|
| CST Algebra I Test | |||
| 2010 | 2.0% | 2.0% | 22.0% |
| 2009 | 2.0% | 3.0% | 21.0% |
| 2008 | 8.0% | 7.0% | 18.0% |
| CST Biology Test | |||
| 2010 | 22.0% | 22.0% | 55.0% |
| 2009 | 35.0% | 34.0% | 51.0% |
| 2008 | 39.0% | 39.0% | 52.0% |
| CST English-Language Arts Test | |||
| 2010 | 21.0% | 20.0% | 54.0% |
| 2009 | 25.0% | 24.0% | 50.0% |
| 2008 | 21.0% | 19.0% | 49.0% |
| CST Geometry Test | |||
| 2010 | 13.0% | 13.0% | 46.0% |
| 2009 | 16.0% | 16.0% | 47.0% |
| 2008 | 28.0% | 28.0% | 43.0% |
| CST Earth Science Test | |||
| 2009 | 7.0% | 7.0% | 29.0% |
| 2008 | 10.0% | 9.0% | 31.0% |
| CST General Mathematics Test | |||
| 2009 | 2.0% | 2.0% | 17.0% |
| 2008 | 9.0% | 9.0% | 18.0% |
Grade 10 - % of students at or above proficiency
| School | District | State | |
|---|---|---|---|
| CST Algebra I Test | |||
| 2010 | 1.0% | 3.0% | 12.0% |
| 2009 | - | - | - |
| 2008 | 6.0% | 5.0% | 9.0% |
| CST Algebra II Test | |||
| 2010 | 9.0% | 9.0% | 40.0% |
| 2009 | 23.0% | 23.0% | 37.0% |
| 2008 | 10.0% | 10.0% | 36.0% |
| CST Biology Test | |||
| 2010 | 10.0% | 10.0% | 38.0% |
| 2009 | 19.0% | 19.0% | 34.0% |
| 2008 | 12.0% | 12.0% | 35.0% |
| CST Chemistry Test | |||
| 2010 | 38.0% | 38.0% | 47.0% |
| 2009 | 14.0% | 14.0% | 44.0% |
| CST English-Language Arts Test | |||
| 2010 | 19.0% | 17.0% | 45.0% |
| 2009 | 20.0% | 17.0% | 44.0% |
| 2008 | 18.0% | 16.0% | 41.0% |
| CST Geometry Test | |||
| 2010 | 1.0% | 1.0% | 14.0% |
| 2009 | 8.0% | 8.0% | 14.0% |
| 2008 | 13.0% | 13.0% | 12.0% |
| CST Science Test | |||
| 2010 | 23.0% | 21.0% | 46.0% |
| 2009 | 27.0% | 23.0% | 44.0% |
| 2008 | 20.0% | 18.0% | 40.0% |
| CST World History Test | |||
| 2010 | 30.0% | 28.0% | 42.0% |
| 2009 | 27.0% | 23.0% | 38.0% |
| 2008 | 9.0% | 9.0% | 33.0% |
Grade 11 - % of students at or above proficiency
| School | District | State | |
|---|---|---|---|
| CST Algebra II Test | |||
| 2010 | 4.0% | 4.0% | 14.0% |
| 2009 | 5.0% | 5.0% | 12.0% |
| CST Biology Test | |||
| 2010 | 31.0% | 26.0% | 46.0% |
| 2009 | 31.0% | 25.0% | 41.0% |
| 2008 | 11.0% | 6.0% | 39.0% |
| CST Chemistry Test | |||
| 2010 | 13.0% | 13.0% | 30.0% |
| 2009 | 1.0% | 1.0% | 27.0% |
| 2008 | 6.0% | 6.0% | 25.0% |
| CST Earth Science Test | |||
| 2010 | 13.0% | 7.0% | 32.0% |
| CST English-Language Arts Test | |||
| 2010 | 18.0% | 14.0% | 42.0% |
| 2009 | 17.0% | 13.0% | 40.0% |
| 2008 | 13.0% | 10.0% | 37.0% |
| CST Geometry Test | |||
| 2010 | 1.0% | 1.0% | 6.0% |
| 2009 | 1.0% | 1.0% | 7.0% |
| 2008 | 3.0% | 3.0% | 6.0% |
| CST Summative High School Math Test | |||
| 2010 | 31.0% | 31.0% | 50.0% |
| 2009 | - | - | - |
| 2008 | 3.0% | 3.0% | 43.0% |
| CST U.S. History Test | |||
| 2010 | 25.0% | 19.0% | 45.0% |
| 2009 | 27.0% | 20.0% | 44.0% |
| 2008 | 21.0% | 15.0% | 38.0% |
| CST World History Test | |||
| 2010 | 27.0% | 9.0% | 15.0% |
| 2009 | 19.0% | 9.0% | 11.0% |
| 2008 | 6.0% | 7.0% | 9.0% |
End of Course - % of students at or above proficiency
| School | District | State | |
|---|---|---|---|
| CST Algebra I Test | |||
| 2010 | 2.0% | 4.0% | 31.0% |
| 2009 | 1.0% | 9.0% | 28.0% |
| 2008 | 5.0% | 8.0% | 25.0% |
| CST Algebra II Test | |||
| 2010 | 7.0% | 7.0% | 31.0% |
| 2009 | 17.0% | 17.0% | 28.0% |
| 2008 | 4.0% | 4.0% | 27.0% |
| CST Biology Test | |||
| 2010 | 19.0% | 18.0% | 46.0% |
| 2009 | 25.0% | 24.0% | 42.0% |
| 2008 | 19.0% | 17.0% | 42.0% |
| CST Chemistry Test | |||
| 2010 | 25.0% | 25.0% | 38.0% |
| 2009 | 7.0% | 7.0% | 36.0% |
| 2008 | 4.0% | 4.0% | 32.0% |
| CST Earth Science Test | |||
| 2010 | 12.0% | 7.0% | 33.0% |
| 2009 | 5.0% | 5.0% | 28.0% |
| 2008 | 9.0% | 8.0% | 28.0% |
| CST Geometry Test | |||
| 2010 | 4.0% | 4.0% | 27.0% |
| 2009 | 8.0% | 8.0% | 26.0% |
| 2008 | 14.0% | 14.0% | 24.0% |
| CST Summative High School Math Test | |||
| 2010 | 27.0% | 27.0% | 54.0% |
| 2009 | - | - | - |
| 2008 | 3.0% | 3.0% | 47.0% |
| CST World History Test | |||
| 2010 | 30.0% | 26.0% | 41.0% |
| 2009 | 26.0% | 20.0% | 38.0% |
| 2008 | 8.0% | 8.0% | 33.0% |
| CST General Mathematics Test | |||
| 2009 | 2.0% | 10.0% | 26.0% |
| 2008 | 9.0% | 6.0% | 27.0% |
Source: CA Department of Education 2009-2010
School Map and Similar Schools Nearby
Click to Activate Map of Nearby School Campuses
Private
Public
This School
Similar Schools Nearby
| El Monte Junior High School 5-9 | 909 Students | 0.4 miles away | Not Yet Rated | |
| Orange Cove High School 9-12 | 665 Students | 5.2 miles away | ![]() 5 out of 5 | |
| Dinuba High School 9-12 | 1,733 Students | 5.5 miles away | ![]() 5 out of 5 | |
| Reedley High School 9-12 | 1,902 Students | 10.0 miles away | Not Yet Rated | |
| Woodlake High School 9-12 | 781 Students | 13.6 miles away | Not Yet Rated | |
| Parlier High School 9-12 | 821 Students | 14.0 miles away | Not Yet Rated | |
| Kingsburg High School 9-12 | 1,131 Students | 14.7 miles away | Not Yet Rated | |
| Parlier Junior High School 7-8 | 464 Students | 14.8 miles away | Not Yet Rated | |
| Redwood High School 9-12 | 1,958 Students | 15.2 miles away | Not Yet Rated | |
| Mt. Whitney High School 9-12 | 1,692 Students | 15.7 miles away | Not Yet Rated | |
Compare This School To Nearby Schools ->
School Community Forum

Join a discussion about Orosi High School and talk to others in the community including students, parents, teachers, and administrators.
Popular Discussion Topics
- Admissions and Registration Questions (e.g. Dress Code and Discipline Policy)
- School Calendar and Upcoming Events (e.g. Graduation)
- After School Programs, Extracurricular Activities, and Athletics (e.g. Football)
- News and Announcements (e.g. Yearbook and Class Supply List Details)
- Graduate and Alumni Events (e.g. Organizing Class Reunions)
Navigation
Can't Find What You Are Looking For?
Rankings
Nearby Cities
Sponsored Links
K-12 Articles
Parent-Teacher Conference Dos and Don'ts
Finals are over and done, and grades have arrived. Now comes the dreaded time to discuss the...
Bullies... What Are They Good For?
Bullies have been around since the beginning of time. We had to deal with bullies, and our parents...
The Most Used Form of Communication
Writing has, quite surprisingly, become more and more important in today's electronic society....


(1 / 5) 