Christine P. Swain Elementary School
Rating
Not Available
Not Available

No Reviews Yet
Find Old Friends From Christine P. Swain Elementary School
Use the form below to search for alumni from Christine P. Swain Elementary School.
School Description
School Summary and Highlights
- Enrolls 409 elementary school students from grades KG-6
- Ranks 3505th out of 5,423 elementary schools in CA.
- 2010 Overall School AYP Met Status: No
Additional Contact Information
- Mailing Address: 5851 Newman St., Cypress, CA 90630
School Operational Details
- Title I Eligible
School District Details
- Cypress Elementary School District
- Per-Pupil Spending: $8,707
- Students Per Teacher: 22.1
- Enrolled Students: 4,003
Faculty Details and Student Enrollment
Students and Faculty
- Total Students Enrolled: 409
- Total Full Time "Equivalent" Teachers: 22.0
- Average Student-To-Teacher Ratio: 18.6
Students Gender Breakdown
- Males: 209 (51.1%)
- Females: 200 (48.9%)
Free Lunch Student Eligibility Breakdown
- Eligible for Reduced Lunch: 52 (12.7%)
- Eligible for Free Lunch: 217 (53.1%)
- Eligible for Either Reduced or Free Lunch: 269 (65.8%)
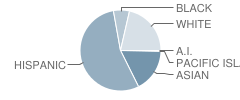
Student Enrollment Distribution by Race / Ethnicity
| Number | Percent | |
|---|---|---|
| American Indian | 1 | 0.2% |
| Black | 25 | 6.1% |
| Asian | 67 | 16.4% |
| Hispanic | 211 | 51.6% |
| White | 83 | 20.3% |
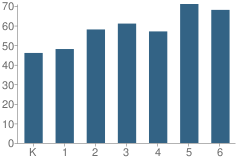
Number of Students Per Grade
| Number | Percent | |
|---|---|---|
| Kindergarten | 46 | 11.2% |
| 1st Grade | 48 | 11.7% |
| 2nd Grade | 58 | 14.2% |
| 3rd Grade | 61 | 14.9% |
| 4th Grade | 57 | 13.9% |
| 5th Grade | 71 | 17.4% |
| 6th Grade | 68 | 16.6% |
Teacher Education Background (2009)
Percent With Master's Degree
School:
21.7%
District:
37.0%
Percent With Bachelor's Degree: 8.7%
Teacher Credentials & Experience (2009)
Percent of Teachers With Credentials: 95.5%
Number of Certificated Staff: 23.0
Average Number of Years of Teacher Experience: 9.5
Average Age
School:
39.9
District:
45.2
Source: CA Department of Education, Source: NCES 2009-2010
School Ratings and Reviews
Be The First To Review Christine P. Swain Elementary School!
School Map and Similar Schools Nearby
Click to Activate Map of Nearby School Campuses
Private
Public
This School
Similar Schools Nearby
| San Marino Elementary School KG-6 | 567 Students | 0.7 miles away | Not Yet Rated | |
| Juliet Morris Elementary School KG-6 | 554 Students | 0.7 miles away |  5 out of 5 | |
| Holder Elementary School KG-6 | 504 Students | 0.9 miles away | Not Yet Rated | |
| Clara J. King Elementary School KG-6 | 483 Students | 0.9 miles away | Not Yet Rated | |
| Frank Vessels Elementary School KG-6 | 692 Students | 1.0 miles away | 5 out of 5 | |
| Buena Terra Elementary School KG-6 | 392 Students | 1.2 miles away | 5 out of 5 | |
| Los Coyotes Elementary School KG-6 | 519 Students | 1.3 miles away | Not Yet Rated | |
| A. E. Arnold Elementary School KG-6 | 508 Students | 1.4 miles away | Not Yet Rated | |
| George B. Miller Elementary School KG-6 | 518 Students | 1.4 miles away | 5 out of 5 | |
| Margaret Landell Elementary School KG-6 | 536 Students | 1.5 miles away |  4 out of 5 | |
Compare This School To Nearby Schools ->
School Community Forum

Join a discussion about Christine P. Swain Elementary School and talk to others in the community including students, parents, teachers, and administrators.
Popular Discussion Topics
- Admissions and Registration Questions (e.g. Dress Code and Discipline Policy)
- School Calendar and Upcoming Events (e.g. Graduation)
- After School Programs, Extracurricular Activities, and Athletics (e.g. Football)
- News and Announcements (e.g. Yearbook and Class Supply List Details)
- Graduate and Alumni Events (e.g. Organizing Class Reunions)
Navigation
Can't Find What You Are Looking For?
Rankings
Nearby Cities
Sponsored Links
K-12 Articles

Summer Advice
A few weeks ago, at the weekly after-school program I run through my local church, a group of...
A few weeks ago, at the weekly after-school program I run through my local church, a group of...

Idle Hands
The worst affliction affecting our kids today is not teen pregnancy, drugs and alcohol, or...
The worst affliction affecting our kids today is not teen pregnancy, drugs and alcohol, or...

Where in the World is Carmen Sandiego?
One of the sensations on YouTube highlights the state of our education system. The spot was...
One of the sensations on YouTube highlights the state of our education system. The spot was...