Denair Charter Academy

No Reviews Yet
Find Old Friends From Denair Charter Academy
Use the form below to search for alumni from Denair Charter Academy.
School Description
School Summary and Highlights
- Enrolls 246 elementary, middle, and high school students from grades KG-12
- Ranks 1158th out of 1,197 high schools in CA.
- 2010 Overall School AYP Met Status: No
Additional Contact Information
- Mailing Address: 3460 Lester Rd., Denair, CA 95316
School Operational Details
- Charter School
School District Details
- Denair Unified School District
- Per-Pupil Spending: $8,539
- Graduation Rate: 100.0%
- Dropout Rate: 1.6%
- Students Per Teacher: 19.2
- Enrolled Students: 1,498
Faculty Details and Student Enrollment
Students and Faculty
- Total Students Enrolled: 246
- Total Full Time "Equivalent" Teachers: 7.0
- Average Student-To-Teacher Ratio: 35.1
Students Gender Breakdown
- Males: 119 (48.4%)
- Females: 127 (51.6%)
Free Lunch Student Eligibility Breakdown
- Eligible for Reduced Lunch: 1 (0.4%)
- Eligible for Free Lunch: 11 (4.5%)
- Eligible for Either Reduced or Free Lunch: 12 (4.9%)
Student Enrollment Distribution by Race / Ethnicity
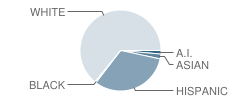
| Number | Percent | |
|---|---|---|
| American Indian | 3 | 1.2% |
| Black | 1 | 0.4% |
| Asian | 4 | 1.6% |
| Hispanic | 67 | 27.2% |
| White | 134 | 54.5% |
Number of Students Per Grade
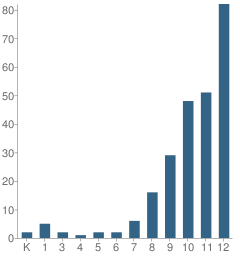
| Number | Percent | |
|---|---|---|
| Kindergarten | 2 | 0.8% |
| 1st Grade | 5 | 2.0% |
| 3rd Grade | 2 | 0.8% |
| 4th Grade | 1 | 0.4% |
| 5th Grade | 2 | 0.8% |
| 6th Grade | 2 | 0.8% |
| 7th Grade | 6 | 2.4% |
| 8th Grade | 16 | 6.5% |
| 9th Grade | 29 | 11.8% |
| 10th Grade | 48 | 19.5% |
| 11th Grade | 51 | 20.7% |
| 12th Grade | 82 | 33.3% |
Graduates Information (2010)
Graduation Rate
School:
83.3%
District:
89.7%
State:
78.6%
Teacher Education Background (2009)
Percent With Master's Degree: 12.5%
Teacher Credentials & Experience (2009)
Percent of Teachers With Credentials: 100.0%
Number of Certificated Staff: 8.0
Average Number of Years of Teacher Experience: 16.7
Average Age
School:
47.9
District:
52.0
Source: CA Department of Education, Source: NCES 2009-2010
School Ratings and Reviews
Be The First To Review Denair Charter Academy!
Sponsored Links
Test Scores and Performance Information
Overall School Rating
How is this determined?
The overall school rating shows that Denair Charter Academy performed on average much worse than most other schools across the state on CST state exams in the following subjects:
- CST Algebra I
- CST Biology
- CST Earth Science
- CST English-Language Arts
- CST General Mathematics
- CST History - Social Science
- CST Mathematics
- CST Science
- CST U.S. History
- CST World History
AYP Results (2010)
Overall AYP Met: No
ELA AYP Met: No
Math AYP Met: No
CST - Test Proficiency by Grade and Subject
Grade 7 - % of students at or above proficiency
| School | District | State | |
|---|---|---|---|
| CST English-Language Arts Test | |||
| 2010 | 6.0% | 43.0% | 55.0% |
| 2009 | 46.0% | 53.0% | 54.0% |
| 2008 | 30.0% | 46.0% | 49.0% |
| CST Mathematics Test | |||
| 2010 | 6.0% | 43.0% | 48.0% |
| 2009 | 8.0% | 30.0% | 43.0% |
| 2008 | 18.0% | 26.0% | 41.0% |
Grade 8 - % of students at or above proficiency
| School | District | State | |
|---|---|---|---|
| CST English-Language Arts Test | |||
| 2010 | 22.0% | 43.0% | 54.0% |
| 2009 | 30.0% | 38.0% | 48.0% |
| 2008 | 29.0% | 46.0% | 45.0% |
| CST General Mathematics Test | |||
| 2010 | 8.0% | 5.0% | 30.0% |
| 2009 | 16.0% | 18.0% | 30.0% |
| 2008 | 14.0% | 18.0% | 31.0% |
| CST History - Social Science Test | |||
| 2010 | 14.0% | 31.0% | 47.0% |
| 2009 | 23.0% | 35.0% | 42.0% |
| 2008 | 14.0% | 28.0% | 36.0% |
| CST Science Test | |||
| 2010 | 19.0% | 53.0% | 59.0% |
| 2009 | 23.0% | 50.0% | 56.0% |
| 2008 | 5.0% | 50.0% | 52.0% |
Grade 9 - % of students at or above proficiency
| School | District | State | |
|---|---|---|---|
| CST Earth Science Test | |||
| 2010 | 28.0% | 28.0% | 35.0% |
| CST English-Language Arts Test | |||
| 2010 | 33.0% | 38.0% | 54.0% |
| 2009 | 30.0% | 42.0% | 50.0% |
| 2008 | 29.0% | 44.0% | 49.0% |
| CST General Mathematics Test | |||
| 2010 | 8.0% | 8.0% | 17.0% |
| 2009 | 22.0% | 22.0% | 17.0% |
| 2008 | 31.0% | 31.0% | 18.0% |
| CST World History Test | |||
| 2010 | 9.0% | 9.0% | 45.0% |
| 2009 | - | - | - |
| 2008 | 6.0% | 6.0% | 36.0% |
| CST Biology Test | |||
| 2009 | 13.0% | 25.0% | 51.0% |
Grade 10 - % of students at or above proficiency
| School | District | State | |
|---|---|---|---|
| CST Algebra I Test | |||
| 2010 | 5.0% | 2.0% | 12.0% |
| CST Biology Test | |||
| 2010 | 15.0% | 28.0% | 38.0% |
| 2009 | 5.0% | 20.0% | 34.0% |
| CST Earth Science Test | |||
| 2010 | 12.0% | 12.0% | 29.0% |
| CST English-Language Arts Test | |||
| 2010 | 14.0% | 27.0% | 45.0% |
| 2009 | 16.0% | 33.0% | 44.0% |
| 2008 | 10.0% | 29.0% | 41.0% |
| CST Science Test | |||
| 2010 | 12.0% | 23.0% | 46.0% |
| 2009 | 8.0% | 22.0% | 44.0% |
| 2008 | 8.0% | 20.0% | 40.0% |
| CST World History Test | |||
| 2010 | 7.0% | 26.0% | 42.0% |
| 2009 | 3.0% | 21.0% | 38.0% |
Grade 11 - % of students at or above proficiency
| School | District | State | |
|---|---|---|---|
| CST Biology Test | |||
| 2010 | 8.0% | 9.0% | 46.0% |
| 2009 | 15.0% | 14.0% | 41.0% |
| CST Earth Science Test | |||
| 2010 | 6.0% | 6.0% | 32.0% |
| 2009 | 19.0% | 17.0% | 26.0% |
| CST English-Language Arts Test | |||
| 2010 | 6.0% | 22.0% | 42.0% |
| 2009 | 17.0% | 26.0% | 40.0% |
| 2008 | 18.0% | 27.0% | 37.0% |
| CST U.S. History Test | |||
| 2010 | 5.0% | 17.0% | 45.0% |
| 2009 | 10.0% | 20.0% | 44.0% |
| 2008 | 5.0% | 25.0% | 38.0% |
| CST World History Test | |||
| 2009 | 10.0% | 9.0% | 11.0% |
End of Course - % of students at or above proficiency
| School | District | State | |
|---|---|---|---|
| CST Algebra I Test | |||
| 2010 | 6.0% | 10.0% | 31.0% |
| CST Biology Test | |||
| 2010 | 12.0% | 22.0% | 46.0% |
| 2009 | 11.0% | 20.0% | 42.0% |
| 2008 | 3.0% | 18.0% | 42.0% |
| CST Earth Science Test | |||
| 2010 | 16.0% | 16.0% | 33.0% |
| 2009 | 18.0% | 14.0% | 28.0% |
| 2008 | 27.0% | 22.0% | 28.0% |
| CST General Mathematics Test | |||
| 2010 | 8.0% | 6.0% | 27.0% |
| 2009 | 20.0% | 20.0% | 26.0% |
| 2008 | 23.0% | 21.0% | 27.0% |
| CST World History Test | |||
| 2010 | 7.0% | 22.0% | 41.0% |
| 2009 | 5.0% | 17.0% | 38.0% |
| 2008 | 2.0% | 24.0% | 33.0% |
Grade 6 - % of students at or above proficiency
| School | District | State | |
|---|---|---|---|
| CST English-Language Arts Test | |||
| 2008 | 33.0% | 43.0% | 47.0% |
Source: CA Department of Education 2009-2010
School Map and Similar Schools Nearby
Click to Activate Map of Nearby School Campuses
Private
Public
This School
Similar Schools Nearby
| Keyes to Learning Charter School KG-12 | 240 Students | 6.1 miles away | Not Yet Rated | |
| Whitmore Charter High School 9-12 | 170 Students | 8.3 miles away | Not Yet Rated | |
| Connecting Waters Charter School KG-12 | 1,904 Students | 8.3 miles away | Not Yet Rated | |
| Aspire Vanguard College Preparatory Academy 6-12 | 197 Students | 9.6 miles away | Not Yet Rated | - |
| Valley Business High School 9-12 | 241 Students | 14.2 miles away | Not Yet Rated | |
| Oakdale Charter School 9-12 | 70 Students | 17.3 miles away | Not Yet Rated | |
Compare This School To Nearby Schools ->
School Community Forum

Join a discussion about Denair Charter Academy and talk to others in the community including students, parents, teachers, and administrators.
Popular Discussion Topics
- Admissions and Registration Questions (e.g. Dress Code and Discipline Policy)
- School Calendar and Upcoming Events (e.g. Graduation)
- After School Programs, Extracurricular Activities, and Athletics (e.g. Football)
- News and Announcements (e.g. Yearbook and Class Supply List Details)
- Graduate and Alumni Events (e.g. Organizing Class Reunions)
Navigation
Can't Find What You Are Looking For?
Rankings
Nearby Cities
Sponsored Links
K-12 Articles
School's out for Recess
Recess used to be the best part of school; that and lunch. But today, a shocking two-thirds of...
Strategies to Help Kids Cope with Stress
Many parents believe that kids don't experience stress. Nothing could be further from the truth....
Helping Young Children with Printing and Cursive Writing
Is your child experiencing difficulty printing or writing? Is he unable to print or write legibly,...
