Irving Elementary School
Rating
Not Available
Not Available

No Reviews Yet
Find Old Friends From Irving Elementary School
Use the form below to search for alumni from Irving Elementary School.
School Description
School Summary and Highlights
- Enrolls 326 elementary school students from grades KG-6
- Ranks 298th out of 1,895 elementary schools in PA.
- 2010 Overall School AYP Met Status: Made AYP
Additional Contact Information
- Principal or Admin: Sherry Buck
School Operational Details
- Title I Eligible
- Magnet School
School District Details
- Altoona Area School District
- Per-Pupil Spending: $9,310
- Graduation Rate: 72.2%
- Dropout Rate: 4.7%
- Students Per Teacher: 15.5
- Enrolled Students: 7,995
Faculty Details and Student Enrollment
Students and Faculty
- Total Students Enrolled: 326
- Total Full Time "Equivalent" Teachers: 16.1
- Average Student-To-Teacher Ratio: 20.3
Students Gender Breakdown
- Males: 159 (48.8%)
- Females: 167 (51.2%)
Free Lunch Student Eligibility Breakdown
- Eligible for Reduced Lunch: 45 (13.8%)
- Eligible for Free Lunch: 85 (26.1%)
- Eligible for Either Reduced or Free Lunch: 130 (39.9%)
Student Enrollment Distribution by Race / Ethnicity
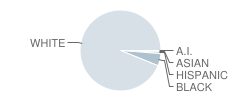
| Number | Percent | |
|---|---|---|
| American Indian | 1 | 0.3% |
| Black | 16 | 4.9% |
| Asian | 1 | 0.3% |
| Hispanic | 2 | 0.6% |
| White | 306 | 93.9% |
Number of Students Per Grade
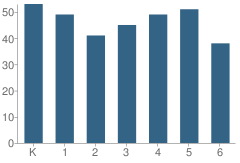
| Number | Percent | |
|---|---|---|
| Kindergarten | 53 | 16.3% |
| 1st Grade | 49 | 15.0% |
| 2nd Grade | 41 | 12.6% |
| 3rd Grade | 45 | 13.8% |
| 4th Grade | 49 | 15.0% |
| 5th Grade | 51 | 15.6% |
| 6th Grade | 38 | 11.7% |
Low-Income Enrollment (2011)
Percent of Students from Low-Income Families
School:
33.7%
District:
54.4%
Source: PA Department of Education, Source: NCES 2009-2010
School Ratings and Reviews
Be The First To Review Irving Elementary School!
School Map and Similar Schools Nearby
Click to Activate Map of Nearby School Campuses
Private
Public
This School
Similar Schools Nearby
| Juniata Gap Elementary School KG-6 | 596 Students | 0.4 miles away |  5 out of 5 | |
| Wright Elementary School KG-6 | 297 Students | 0.6 miles away | Not Yet Rated | |
| Washington-Jefferson Elementary School KG-6 | 346 Students | 0.7 miles away | 5 out of 5 | |
| Juniata Elementary School KG-6 | 400 Students | 0.8 miles away | Not Yet Rated | |
| Penn-Lincoln Elementary School KG-6 | 397 Students | 1.1 miles away | Not Yet Rated | |
| Logan Elementary School KG-6 | 591 Students | 1.4 miles away | Not Yet Rated | |
| Pleasant Valley Elementary School KG-6 | 549 Students | 2.7 miles away | Not Yet Rated | |
| Baker Elementary School KG-6 | 305 Students | 3.0 miles away | Not Yet Rated | |
| Mowrie A Ebner Elementary School KG-6 | 531 Students | 3.6 miles away | Not Yet Rated | |
| Bellwood Antis Middle School 5-8 | 405 Students | 5.8 miles away | 5 out of 5 | |
Compare This School To Nearby Schools ->
School Community Forum

Join a discussion about Irving Elementary School and talk to others in the community including students, parents, teachers, and administrators.
Popular Discussion Topics
- Admissions and Registration Questions (e.g. Dress Code and Discipline Policy)
- School Calendar and Upcoming Events (e.g. Graduation)
- After School Programs, Extracurricular Activities, and Athletics (e.g. Football)
- News and Announcements (e.g. Yearbook and Class Supply List Details)
- Graduate and Alumni Events (e.g. Organizing Class Reunions)
Navigation
Can't Find What You Are Looking For?
Rankings
Nearby Cities
Sponsored Links
K-12 Articles

A Cheat Sheet on Cheating
Senior projects are coming due and finals are coming up. Spring has sprung, and with spring comes...
Senior projects are coming due and finals are coming up. Spring has sprung, and with spring comes...

Keep Kids Learning All Summer
Early in the 20th century schools in urban districts operated all year `round. However, in rural...
Early in the 20th century schools in urban districts operated all year `round. However, in rural...

Attend Your Teen's Holiday Parties
Christmas and New Years are coming, and with them Christmas and New Years Eve parties. At many of...
Christmas and New Years are coming, and with them Christmas and New Years Eve parties. At many of...