Dunsmuir High School
Rating
Not Available
Not Available

5 out of 5 | 1 Review
Find Old Friends From Dunsmuir High School
Use the form below to search for alumni from Dunsmuir High School.
School Description
School Summary and Highlights
- Enrolls 96 high school students from grades 9-12
- Ranks 788th out of 1,197 high schools in CA.
- 2010 Overall School AYP Met Status: Yes
School Operational Details
- Title I EligibleAll students of this school are eligible for participation in authorized programs.
School District Details
- Dunsmuir Joint Union High School District
- Per-Pupil Spending: $14,380
- Students Per Teacher: 11.1
- Enrolled Students: 96
Faculty Details and Student Enrollment
Students and Faculty
- Total Students Enrolled: 96
- Total Full Time "Equivalent" Teachers: 7.5
- Average Student-To-Teacher Ratio: 12.8
Students Gender Breakdown
- Males: 59 (61.5%)
- Females: 37 (38.5%)
Free Lunch Student Eligibility Breakdown
- Eligible for Reduced Lunch: 4 (4.2%)
- Eligible for Free Lunch: 63 (65.6%)
- Eligible for Either Reduced or Free Lunch: 67 (69.8%)
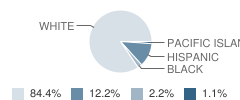
Student Enrollment Distribution by Race / Ethnicity
| Number | Percent | |
|---|---|---|
| American Indian | - | - |
| Black | 2 | 2.1% |
| Asian | - | - |
| Hispanic | 11 | 11.5% |
| White | 76 | 79.2% |
Number of Students Per Grade

| Number | Percent | |
|---|---|---|
| 9th Grade | 24 | 25.0% |
| 10th Grade | 20 | 20.8% |
| 11th Grade | 29 | 30.2% |
| 12th Grade | 23 | 24.0% |
Teacher Education Background (2009)
Percent With Master's Degree: 22.2%
Percent With Bachelor's Degree: 11.1%
Teacher Credentials & Experience (2009)
Percent of Teachers With Credentials: 100.0%
Number of Certificated Staff: 9.0
Average Number of Years of Teacher Experience: 16.3
Average Age: 48.7
Source: CA Department of Education, Source: NCES 2009-2010
School Ratings and Reviews
Overall Rating: 5

5 out of 5 | 1 Review
The Overall Rating is the school's average rating from parents, students, school faculty and staff. The highest rating is five apples and the lowest is one apple.
Share Your Review About This School
1 review for Dunsmuir High School
- Reviewed by Community Member on December 19, 2008
- Rating:
 (5 / 5) Flag as inappropriate
 - What make DHS special?
The staff's dedication to the students.
The administration's dedication to providing the best learning environment for all students.
And the students who come from all areas of society and with a huge range of skills.
School Map and Similar Schools Nearby
Click to Activate Map of Nearby School Campuses
Private
Public
This School
Similar Schools Nearby
| Mt. Shasta High School 9-12 | 400 Students | 9.7 miles away |  3 out of 5 | |
| Weed High School 9-12 | 201 Students | 15.9 miles away | Not Yet Rated | |
Compare This School To Nearby Schools ->
Navigation
Can't Find What You Are Looking For?
Rankings
Nearby Cities
Sponsored Links
K-12 Articles

The Impact on Adopted Children at School
Children who are adopted can be affected both academically and socially at school. Many times...
Children who are adopted can be affected both academically and socially at school. Many times...

Those Pesky Little Transitions
Transitions are rarely easy, yet we have to encounter them every day of our lives. For school-aged...
Transitions are rarely easy, yet we have to encounter them every day of our lives. For school-aged...

The Adolescent Monster
"What happened to my sweet little baby?" Every parent has or will ask that sometime during the...
"What happened to my sweet little baby?" Every parent has or will ask that sometime during the...