Brockway Area Junior / High School
Rating
Not Available
Not Available

No Reviews Yet
Find Old Friends From Brockway Area Junior / High School
Use the form below to search for alumni from Brockway Area Junior / High School.
School Description
School Summary and Highlights
- Enrolls 490 middle and high school students from grades 7-12
- Ranks 479th out of 639 high schools in PA.
- 2010 Overall School AYP Met Status: Made AYP
Additional Contact Information
- Principal or Admin: Denise Carlini
School District Details
- Brockway Area School District
- Per-Pupil Spending: $10,115
- Graduation Rate: 78.8%
- Students Per Teacher: 13.0
- Enrolled Students: 1,055
Faculty Details and Student Enrollment
Students and Faculty
- Total Students Enrolled: 490
- Total Full Time "Equivalent" Teachers: 39.6
- Average Student-To-Teacher Ratio: 12.4
Students Gender Breakdown
- Males: 246 (50.2%)
- Females: 244 (49.8%)
Free Lunch Student Eligibility Breakdown
- Eligible for Reduced Lunch: 54 (11.0%)
- Eligible for Free Lunch: 132 (26.9%)
- Eligible for Either Reduced or Free Lunch: 186 (38.0%)
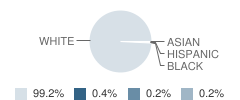
Student Enrollment Distribution by Race / Ethnicity
| Number | Percent | |
|---|---|---|
| American Indian | - | - |
| Black | 1 | 0.2% |
| Asian | 2 | 0.4% |
| Hispanic | 1 | 0.2% |
| White | 486 | 99.2% |
Number of Students Per Grade

| Number | Percent | |
|---|---|---|
| 7th Grade | 78 | 15.9% |
| 8th Grade | 95 | 19.4% |
| 9th Grade | 68 | 13.9% |
| 10th Grade | 93 | 19.0% |
| 11th Grade | 80 | 16.3% |
| 12th Grade | 76 | 15.5% |
Low-Income Enrollment (2011)
Percent of Students from Low-Income Families
School:
39.5%
District:
44.2%
Graduation and Dropout Rates (2010)
Graduation Rate
School:
92.4%
District:
92.4%
Dropout Rate
School:
1.4%
District:
1.4%
Post Graduate Profiles (2010)
Percent College Bound
School:
59.5%
District:
59.5%
State:
72.6%
Percent Enrolling in 2-Year or 4-Year College/University
School:
59.5%
District:
59.5%
State:
69.4%
Faculty Information (2010)
ASSISTANT/VICE PRINCIPAL: MARK DIPPOLD
Source: PA Department of Education, Source: NCES 2009-2010
School Ratings and Reviews
Be The First To Review Brockway Area Junior / High School!
School Map and Similar Schools Nearby
Click to Activate Map of Nearby School Campuses
Private
Public
This School
Similar Schools Nearby
| Dubois Area High School 9-12 | 1,246 Students | 9.1 miles away | Not Yet Rated | |
| Ridgway Area High School 9-12 | 336 Students | 13.3 miles away | Not Yet Rated | |
| Brookville Junior / High School 7-12 | 759 Students | 15.8 miles away | Not Yet Rated | |
| St Marys Area High School 9-12 | 781 Students | 16.3 miles away | Not Yet Rated | |
| Johnsonburg Area High School 7-12 | 342 Students | 18.7 miles away |  5 out of 5 | |
Compare This School To Nearby Schools ->
School Community Forum

Join a discussion about Brockway Area Junior / High School and talk to others in the community including students, parents, teachers, and administrators.
Popular Discussion Topics
- Admissions and Registration Questions (e.g. Dress Code and Discipline Policy)
- School Calendar and Upcoming Events (e.g. Graduation)
- After School Programs, Extracurricular Activities, and Athletics (e.g. Football)
- News and Announcements (e.g. Yearbook and Class Supply List Details)
- Graduate and Alumni Events (e.g. Organizing Class Reunions)
Navigation
Can't Find What You Are Looking For?
Rankings
Nearby Cities
Sponsored Links
K-12 Articles

Se Hablan Otras Idiomas?
In the late 1990s, the Salem-Keizer school district in Oregon began requiring every student in its...
In the late 1990s, the Salem-Keizer school district in Oregon began requiring every student in its...

The First Day of School
The first day of kindergarten is a rite of passage for any student. Every mother cries and...
The first day of kindergarten is a rite of passage for any student. Every mother cries and...

School Lunches ... Hot or Cold?
First there were four, now there are six, no one knows how many more there may be in the future....
First there were four, now there are six, no one knows how many more there may be in the future....