Oak Grove High School
Rating
Not Available
Not Available

1 out of 5 | 1 Review
Find Old Friends From Oak Grove High School
Use the form below to search for alumni from Oak Grove High School.
School Description
School Summary and Highlights
- Enrolls 2,395 high school students from grades 9-12
- Ranks 804th out of 1,197 high schools in CA.
- 2010 Overall School AYP Met Status: No
Additional Contact Information
- Mailing Address: 285 Blossom Hill Rd., San Jose, CA 95123
School Operational Details
- Title I Eligible
School District Details
- East Side Union High School District
- Per-Pupil Spending: $9,158
- Graduation Rate: 100.0%
- Dropout Rate: 5.0%
- Students Per Teacher: 24.0
- Enrolled Students: 26,864
Faculty Details and Student Enrollment
Students and Faculty
- Total Students Enrolled: 2,395
- Total Full Time "Equivalent" Teachers: 99.8
- Average Student-To-Teacher Ratio: 24.0
Students Gender Breakdown
- Males: 1,276 (53.3%)
- Females: 1,119 (46.7%)
Free Lunch Student Eligibility Breakdown
- Eligible for Reduced Lunch: 191 (8.0%)
- Eligible for Free Lunch: 728 (30.4%)
- Eligible for Either Reduced or Free Lunch: 919 (38.4%)
Student Enrollment Distribution by Race / Ethnicity
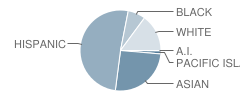
| Number | Percent | |
|---|---|---|
| American Indian | 6 | 0.3% |
| Black | 169 | 7.1% |
| Asian | 613 | 25.6% |
| Hispanic | 1,216 | 50.8% |
| White | 356 | 14.9% |
Number of Students Per Grade
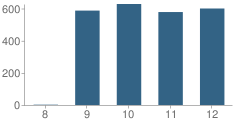
| Number | Percent | |
|---|---|---|
| 8th Grade | 2 | 0.08% |
| 9th Grade | 587 | 24.5% |
| 10th Grade | 628 | 26.2% |
| 11th Grade | 578 | 24.1% |
| 12th Grade | 600 | 25.1% |
Graduates Information (2010)
Graduation Rate
School:
84.5%
District:
81.0%
State:
78.6%
Teacher Education Background (2009)
Percent With Ph.D.
School:
2.4%
District:
7.6%
Percent With Master's Degree
School:
16.0%
District:
27.8%
Percent With Bachelor's Degree
School:
7.2%
District:
13.9%
Teacher Credentials & Experience (2009)
Percent of Teachers With Emergency Credentials: 2.6%
Percent of Teachers With Credentials: 94.7%
Number of Certificated Staff: 125.0
Average Number of Years of Teacher Experience: 17.3
Average Age
School:
45.4
District:
49.2
Source: CA Department of Education, Source: NCES 2009-2010
School Ratings and Reviews
Overall Rating: 1

1 out of 5 | 1 Review
The Overall Rating is the school's average rating from parents, students, school faculty and staff. The highest rating is five apples and the lowest is one apple.
Share Your Review About This School
1 review for Oak Grove High School
- Reviewed by Parent/Guardian on November 09, 2008
- Rating:
 (1 / 5) Flag as inappropriate
 - It was a HUGH mistake entrolling our student in the Talent Development program at this school. The Administration in this program is very unethical. Please consider any and all other Private schools in the Augusta area. It was the WORST experience my child has ever had. I would NEVER recommend this school to ANYBODY!!!
School Map and Similar Schools Nearby
Click to Activate Map of Nearby School Campuses
Private
Public
This School
Similar Schools Nearby
| Santa Teresa High School 9-12 | 2,426 Students | 1.3 miles away |  3.5 out of 5 | |
| Gunderson High School 9-12 | 1,073 Students | 1.9 miles away |  4 out of 5 | |
| Sylvandale Junior High School 7-8 | 874 Students | 2.5 miles away | Not Yet Rated | |
| Leland High School 9-12 | 1,845 Students | 2.7 miles away | Not Yet Rated | |
| Andrew P. Hill High School 9-12 | 2,373 Students | 2.9 miles away | Not Yet Rated | |
| Pioneer High School 9-12 | 1,595 Students | 3.6 miles away | Not Yet Rated | |
| Silver Creek High School 9-12 | 2,528 Students | 3.7 miles away | Not Yet Rated | |
| Branham High School 9-12 | 1,386 Students | 4.4 miles away | Not Yet Rated | |
| Yerba Buena High School 9-12 | 1,697 Students | 5.1 miles away | Not Yet Rated | |
| Willow Glen High School 9-12 | 1,456 Students | 5.1 miles away | Not Yet Rated | |
Compare This School To Nearby Schools ->
School Community Forum

Join a discussion about Oak Grove High School and talk to others in the community including students, parents, teachers, and administrators.
Popular Discussion Topics
- Admissions and Registration Questions (e.g. Dress Code and Discipline Policy)
- School Calendar and Upcoming Events (e.g. Graduation)
- After School Programs, Extracurricular Activities, and Athletics (e.g. Football)
- News and Announcements (e.g. Yearbook and Class Supply List Details)
- Graduate and Alumni Events (e.g. Organizing Class Reunions)
Navigation
Can't Find What You Are Looking For?
Rankings
Nearby Cities
Sponsored Links
K-12 Articles

School Lunches ... Hot or Cold?
First there were four, now there are six, no one knows how many more there may be in the future....
First there were four, now there are six, no one knows how many more there may be in the future....

Imho
I was watching Headline News's news ticker when I read something that made me LOL. The ticker said...
I was watching Headline News's news ticker when I read something that made me LOL. The ticker said...

Those Pesky Little Transitions
Transitions are rarely easy, yet we have to encounter them every day of our lives. For school-aged...
Transitions are rarely easy, yet we have to encounter them every day of our lives. For school-aged...