Latino College Preparatory Academy
Rating
Not Available
Not Available

No Reviews Yet
Find Old Friends From Latino College Preparatory Academy
Use the form below to search for alumni from Latino College Preparatory Academy.
School Description
School Summary and Highlights
- Enrolls 330 high school students from grades 9-12
- Ranks 1093rd out of 1,197 high schools in CA.
- 2010 Overall School AYP Met Status: No
Additional Contact Information
- Mailing Address: 14271 Story Rd., San Jose, CA 95127
School Operational Details
- Title I Eligible
- Charter School
School District Details
- East Side Union High School District
- Per-Pupil Spending: $9,158
- Graduation Rate: 100.0%
- Dropout Rate: 5.0%
- Students Per Teacher: 24.0
- Enrolled Students: 26,864
Faculty Details and Student Enrollment
Students and Faculty
- Total Students Enrolled: 330
- Total Full Time "Equivalent" Teachers: 23.1
- Average Student-To-Teacher Ratio: 14.3
Students Gender Breakdown
- Males: 153 (46.4%)
- Females: 177 (53.6%)
Free Lunch Student Eligibility Breakdown
- Eligible for Reduced Lunch: 21 (6.4%)
- Eligible for Free Lunch: 306 (92.7%)
- Eligible for Either Reduced or Free Lunch: 327 (99.1%)
Student Enrollment Distribution by Race / Ethnicity

| Number | Percent | |
|---|---|---|
| American Indian | - | - |
| Black | - | - |
| Asian | - | - |
| Hispanic | 330 | 100.0% |
| White | - | - |
Number of Students Per Grade
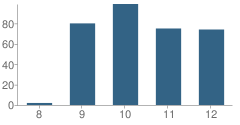
| Number | Percent | |
|---|---|---|
| 8th Grade | 2 | 0.6% |
| 9th Grade | 80 | 24.2% |
| 10th Grade | 99 | 30.0% |
| 11th Grade | 75 | 22.7% |
| 12th Grade | 74 | 22.4% |
Teacher Education Background (2009)
Percent With Ph.D.
School:
3.4%
District:
7.6%
Percent With Master's Degree
School:
10.3%
District:
27.8%
Percent With Bachelor's Degree
School:
27.6%
District:
13.9%
Teacher Credentials & Experience (2009)
Percent of Teachers With Emergency Credentials: 11.5%
Percent of Teachers With Credentials: 46.2%
Number of Certificated Staff: 29.0
Average Number of Years of Teacher Experience: 6.0
Average Age
School:
35.4
District:
49.2
Source: CA Department of Education, Source: NCES 2009-2010
School Ratings and Reviews
Be The First To Review Latino College Preparatory Academy!
School Map and Similar Schools Nearby
Click to Activate Map of Nearby School Campuses
Private
Public
This School
Similar Schools Nearby
| Escuela Popular / Center for Training and Careers, Family Learning School 9-12 | 1 Students | 1.8 miles away | Not Yet Rated | |
| Leadership Public Schools - East San Jose 9-12 | 329 Students | 2.1 miles away | Not Yet Rated | |
| Kipp San Jose Collegiate School 9-12 | 161 Students | 2.5 miles away | Not Yet Rated | - |
| San Jose Conservation Corps Charter School 9-12 | 344 Students | 4.5 miles away | Not Yet Rated | - |
| Escuela Popular Accelerated Family Learning School KG-12 | 316 Students | 4.8 miles away | Not Yet Rated | |
| South Bay Preparatory School 4-10 | 58 Students | 4.9 miles away | Not Yet Rated | - |
| Downtown College Preparatory School 9-12 | 415 Students | 5.7 miles away |  5 out of 5 | |
| University Preparatory Academy Charter 7-12 | 324 Students | 5.7 miles away | Not Yet Rated | - |
Compare This School To Nearby Schools ->
School Community Forum

Join a discussion about Latino College Preparatory Academy and talk to others in the community including students, parents, teachers, and administrators.
Popular Discussion Topics
- Admissions and Registration Questions (e.g. Dress Code and Discipline Policy)
- School Calendar and Upcoming Events (e.g. Graduation)
- After School Programs, Extracurricular Activities, and Athletics (e.g. Football)
- News and Announcements (e.g. Yearbook and Class Supply List Details)
- Graduate and Alumni Events (e.g. Organizing Class Reunions)
Navigation
Can't Find What You Are Looking For?
Rankings
Sponsored Links
K-12 Articles

Does Your Child's Teacher Make a Difference
School improvement is always in the news. Teachers demand smaller class sizes. The government calls...
School improvement is always in the news. Teachers demand smaller class sizes. The government calls...

Summer Reading
In 1998, a book was published in the US that turned a hatred of reading to love. "Harry Potter and...
In 1998, a book was published in the US that turned a hatred of reading to love. "Harry Potter and...

Bullies... What Are They Good For?
Bullies have been around since the beginning of time. We had to deal with bullies, and our parents...
Bullies have been around since the beginning of time. We had to deal with bullies, and our parents...