Washington School
Rating
Not Available
Not Available

No Reviews Yet
Find Old Friends From Washington School
Use the form below to search for alumni from Washington School.
School Description
School Summary and Highlights
- Enrolls 477 elementary school students from grades KG-6
- Ranks 4602nd out of 5,423 elementary schools in CA.
- 2010 Overall School AYP Met Status: No
Additional Contact Information
- Mailing Address: 223 South First St., El Centro, CA 92243
School Operational Details
- Title I EligibleAll students of this school are eligible for participation in authorized programs.
School District Details
- El Centro Elementary School District
- Per-Pupil Spending: $9,063
- Students Per Teacher: 21.9
- Enrolled Students: 5,584
Faculty Details and Student Enrollment
Students and Faculty
- Total Students Enrolled: 477
- Total Full Time "Equivalent" Teachers: 21.5
- Average Student-To-Teacher Ratio: 22.2
Students Gender Breakdown
- Males: 230 (48.2%)
- Females: 247 (51.8%)
Free Lunch Student Eligibility Breakdown
- Eligible for Reduced Lunch: 27 (5.7%)
- Eligible for Free Lunch: 429 (89.9%)
- Eligible for Either Reduced or Free Lunch: 456 (95.6%)
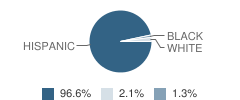
Student Enrollment Distribution by Race / Ethnicity
| Number | Percent | |
|---|---|---|
| American Indian | - | - |
| Black | 6 | 1.3% |
| Asian | - | - |
| Hispanic | 461 | 96.6% |
| White | 10 | 2.1% |
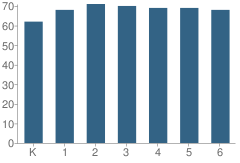
Number of Students Per Grade
| Number | Percent | |
|---|---|---|
| Kindergarten | 62 | 13.0% |
| 1st Grade | 68 | 14.3% |
| 2nd Grade | 71 | 14.9% |
| 3rd Grade | 70 | 14.7% |
| 4th Grade | 69 | 14.5% |
| 5th Grade | 69 | 14.5% |
| 6th Grade | 68 | 14.3% |
Teacher Education Background (2009)
Percent With Master's Degree
School:
33.3%
District:
58.8%
Percent With Bachelor's Degree: 4.2%
Teacher Credentials & Experience (2009)
Percent of Teachers With Credentials: 100.0%
Number of Certificated Staff: 24.0
Average Number of Years of Teacher Experience: 12.1
Average Age
School:
43.5
District:
42.0
Source: CA Department of Education, Source: NCES 2009-2010
School Ratings and Reviews
Be The First To Review Washington School!
School Map and Similar Schools Nearby
Click to Activate Map of Nearby School Campuses
Private
Public
This School
Similar Schools Nearby
| Harding Elementary School KG-6 | 484 Students | 1.1 miles away | Not Yet Rated | |
| Mckinley Elementary School KG-5 | 489 Students | 1.1 miles away |  5 out of 5 | |
| Lincoln Elementary School KG-5 | 415 Students | 1.2 miles away | 5 out of 5 | |
| Desert Garden Elementary School KG-6 | 434 Students | 1.4 miles away | Not Yet Rated | |
| Margaret Hedrick Elementary School KG-6 | 481 Students | 1.8 miles away | Not Yet Rated | |
| De Anza School KG-7 | 491 Students | 2.1 miles away | Not Yet Rated | |
| Martin Luther King Jr. Elementary School KG-5 | 401 Students | 2.1 miles away | 5 out of 5 | |
| Sunflower Elementary School KG-6 | 465 Students | 2.3 miles away | Not Yet Rated | |
| T. L. Waggoner Elementary School KG-5 | 707 Students | 3.1 miles away | Not Yet Rated | |
| Mccabe Elementary School KG-8 | 1,160 Students | 3.9 miles away | Not Yet Rated | |
Compare This School To Nearby Schools ->
School Community Forum

Join a discussion about Washington School and talk to others in the community including students, parents, teachers, and administrators.
Popular Discussion Topics
- Admissions and Registration Questions (e.g. Dress Code and Discipline Policy)
- School Calendar and Upcoming Events (e.g. Graduation)
- After School Programs, Extracurricular Activities, and Athletics (e.g. Football)
- News and Announcements (e.g. Yearbook and Class Supply List Details)
- Graduate and Alumni Events (e.g. Organizing Class Reunions)
Navigation
Can't Find What You Are Looking For?
Rankings
Nearby Cities
Sponsored Links
K-12 Articles

Simple Math ... a Simple Gift
Math affects every aspect of our lives-from balancing the checkbook to estimating the amount of...
Math affects every aspect of our lives-from balancing the checkbook to estimating the amount of...

The Very Best Things in the World
A recent poll in the U.K. revealed that children view the "very best thing in the world" as being...
A recent poll in the U.K. revealed that children view the "very best thing in the world" as being...

Bullycide: What is It and How Can It Be Prevented?
Disclaimer: This article expresses my opinion that has been formed by personal experience and...
Disclaimer: This article expresses my opinion that has been formed by personal experience and...