Columbia Elementary School
Rating
Not Available
Not Available

5 out of 5 | 1 Review
Find Old Friends From Columbia Elementary School
Use the form below to search for alumni from Columbia Elementary School.
School Description
School Summary and Highlights
- Enrolls 907 elementary school students from grades KG-8
- Ranks 1376th out of 2,050 middle schools in CA.
- 2010 Overall School AYP Met Status: No
School Operational Details
- Title I EligibleAll students of this school are eligible for participation in authorized programs.
School District Details
- El Monte City Elementary School District
- Per-Pupil Spending: $10,378
- Students Per Teacher: 22.7
- Enrolled Students: 9,909
Faculty Details and Student Enrollment
Students and Faculty
- Total Students Enrolled: 907
- Total Full Time "Equivalent" Teachers: 50.0
- Average Student-To-Teacher Ratio: 18.1
Students Gender Breakdown
- Males: 442 (48.7%)
- Females: 465 (51.3%)
Free Lunch Student Eligibility Breakdown
- Eligible for Reduced Lunch: 60 (6.6%)
- Eligible for Free Lunch: 779 (85.9%)
- Eligible for Either Reduced or Free Lunch: 839 (92.5%)
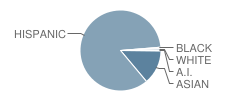
Student Enrollment Distribution by Race / Ethnicity
| Number | Percent | |
|---|---|---|
| American Indian | 2 | 0.2% |
| Black | 5 | 0.6% |
| Asian | 124 | 13.7% |
| Hispanic | 769 | 84.8% |
| White | 7 | 0.8% |
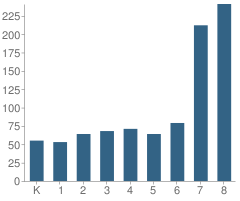
Number of Students Per Grade
| Number | Percent | |
|---|---|---|
| Kindergarten | 55 | 6.1% |
| 1st Grade | 53 | 5.8% |
| 2nd Grade | 64 | 7.1% |
| 3rd Grade | 68 | 7.5% |
| 4th Grade | 71 | 7.8% |
| 5th Grade | 64 | 7.1% |
| 6th Grade | 79 | 8.7% |
| 7th Grade | 212 | 23.4% |
| 8th Grade | 241 | 26.6% |
Teacher Education Background (2009)
Percent With Master's Degree
School:
20.8%
District:
44.8%
Teacher Credentials & Experience (2009)
Percent of Teachers With Credentials: 100.0%
Number of Certificated Staff: 53.0
Average Number of Years of Teacher Experience: 13.3
Average Age
School:
39.3
District:
47.2
Source: CA Department of Education, Source: NCES 2009-2010
School Ratings and Reviews
Overall Rating: 5

5 out of 5 | 1 Review
The Overall Rating is the school's average rating from parents, students, school faculty and staff. The highest rating is five apples and the lowest is one apple.
Share Your Review About This School
1 review for Columbia Elementary School
- Reviewed by Former Student on October 14, 2008
- Rating:
 (5 / 5) Flag as inappropriate
School Map and Similar Schools Nearby
Click to Activate Map of Nearby School Campuses
Private
Public
This School
Similar Schools Nearby
| New Lexington Elementary School KG-6 | 435 Students | 0.7 miles away | Not Yet Rated | |
| Legore Elementary School KG-6 | 650 Students | 0.8 miles away | Not Yet Rated | |
| Wilkerson Elementary School KG-6 | 605 Students | 0.9 miles away |  3.5 out of 5 | |
| Willard F. Payne Elementary School KG-6 | 556 Students | 0.9 miles away |  2 out of 5 | |
| Rio Vista Elementary School KG-6 | 440 Students | 1.0 miles away |  5 out of 5 | |
| Miramonte Elementary School KG-6 | 563 Students | 1.0 miles away | 5 out of 5 | |
| Shirpser Elementary School KG-5 | 508 Students | 1.1 miles away | 5 out of 5 | |
| Baker Elementary School KG-5 | 791 Students | 1.1 miles away |  4.5 out of 5 | |
| Parkview Elementary School KG-6 | 903 Students | 1.1 miles away | 5 out of 5 | |
| Cogswell Elementary School KG-6 | 571 Students | 1.1 miles away | 5 out of 5 | |
Compare This School To Nearby Schools ->
School Community Forum

Join a discussion about Columbia Elementary School and talk to others in the community including students, parents, teachers, and administrators.
Popular Discussion Topics
- Admissions and Registration Questions (e.g. Dress Code and Discipline Policy)
- School Calendar and Upcoming Events (e.g. Graduation)
- After School Programs, Extracurricular Activities, and Athletics (e.g. Football)
- News and Announcements (e.g. Yearbook and Class Supply List Details)
- Graduate and Alumni Events (e.g. Organizing Class Reunions)
Navigation
Can't Find What You Are Looking For?
Rankings
Nearby Cities
Sponsored Links
K-12 Articles

All About Backpacks
Your child riffles through his backpack to find homework assignments, his MP3 player, lunch money...
Your child riffles through his backpack to find homework assignments, his MP3 player, lunch money...

Summer Safety Tips to Keep Kids Safe
It won't be long until kids run from the school, shrieking in delight because they're free for the...
It won't be long until kids run from the school, shrieking in delight because they're free for the...

A Cheat Sheet on Cheating
Senior projects are coming due and finals are coming up. Spring has sprung, and with spring comes...
Senior projects are coming due and finals are coming up. Spring has sprung, and with spring comes...