El Monte High School

No Reviews Yet
Find Old Friends From El Monte High School
Use the form below to search for alumni from El Monte High School.
School Description
School Summary and Highlights
- Enrolls 1,970 high school students from grades 9-12
- Ranks 492nd out of 1,197 high schools in CA.
- 2010 Overall School AYP Met Status: No
Additional Contact Information
- Mailing Address: 3048 North Tyler Ave., El Monte, CA 91731
School Operational Details
- Title I EligibleAll students of this school are eligible for participation in authorized programs.
School District Details
- El Monte Union High School District
- Per-Pupil Spending: $9,309
- Dropout Rate: 2.4%
- Students Per Teacher: 24.3
- Enrolled Students: 10,288
Faculty Details and Student Enrollment
Students and Faculty
- Total Students Enrolled: 1,970
- Total Full Time "Equivalent" Teachers: 79.0
- Average Student-To-Teacher Ratio: 24.9
Students Gender Breakdown
- Males: 997 (50.6%)
- Females: 973 (49.4%)
Free Lunch Student Eligibility Breakdown
- Eligible for Reduced Lunch: 176 (8.9%)
- Eligible for Free Lunch: 1,638 (83.1%)
- Eligible for Either Reduced or Free Lunch: 1,814 (92.1%)
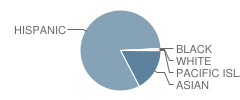
Student Enrollment Distribution by Race / Ethnicity

| Number | Percent | |
|---|---|---|
| American Indian | - | - |
| Black | 3 | 0.2% |
| Asian | 339 | 17.2% |
| Hispanic | 1,610 | 81.7% |
| White | 13 | 0.7% |
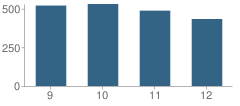
Number of Students Per Grade

| Number | Percent | |
|---|---|---|
| 9th Grade | 520 | 26.4% |
| 10th Grade | 530 | 26.9% |
| 11th Grade | 487 | 24.7% |
| 12th Grade | 433 | 22.0% |
Graduates Information (2010)
Graduation Rate
School:
88.0%
District:
85.5%
State:
78.6%
Teacher Education Background (2009)
Percent With Master's Degree
School:
24.2%
District:
12.5%
Percent With Bachelor's Degree: 3.0%
Teacher Credentials & Experience (2009)
Percent of Teachers With Credentials: 97.6%
Number of Certificated Staff: 99.0
Average Number of Years of Teacher Experience: 15.5
Average Age
School:
42.4
District:
49.9
Source: CA Department of Education, Source: NCES 2009-2010
School Ratings and Reviews
Be The First To Review El Monte High School!
Sponsored Links
Test Scores and Performance Information
Overall School Rating
How is this determined?
The overall school rating shows that El Monte High School performed on average about the same as other schools across the state on CST state exams in the following subjects:
- CST Algebra I
- CST Algebra II
- CST Biology
- CST Chemistry
- CST Earth Science
- CST English-Language Arts
- CST General Mathematics
- CST Geometry
- CST Science
- CST Summative High School Math
- CST U.S. History
- CST World History
AYP Results (2010)
Overall AYP Met: No
ELA AYP Met: No
Math AYP Met: No
Program Improvement (PI) Requirement Under NCLB (2010)
First Year PI Requirement was Implemented: 2009-2010
School's Placement Under NCLB: Year 2
ACT Exam Results (2009)
Percent of Students Taking ACT Exam: 18.4%
Average Combined Score: 19.6
Percent Scoring At or Above 21: 38.9%
SAT Exam Results (2009)
Percent of Students Taking SAT Exam: 28.8%
Average Combined Score: 1,405.6
Critical Reading Average: 456.3
Math Average: 487.6
Writing Average: 461.7
Percent Scoring At or Above 1500: 33.3%
CST - Test Proficiency by Grade and Subject
Grade 9 - % of students at or above proficiency
| School | District | State | |
|---|---|---|---|
| CST Algebra I Test | |||
| 2010 | 24.0% | 25.0% | 22.0% |
| 2009 | 52.0% | 41.0% | 21.0% |
| 2008 | 40.0% | 34.0% | 18.0% |
| CST Earth Science Test | |||
| 2010 | 38.0% | 45.0% | 35.0% |
| 2009 | 35.0% | 39.0% | 29.0% |
| 2008 | 31.0% | 44.0% | 31.0% |
| CST English-Language Arts Test | |||
| 2010 | 41.0% | 48.0% | 54.0% |
| 2009 | 39.0% | 44.0% | 50.0% |
| 2008 | 31.0% | 40.0% | 49.0% |
| CST Geometry Test | |||
| 2010 | 46.0% | 48.0% | 46.0% |
| 2009 | 65.0% | 47.0% | 47.0% |
| 2008 | 48.0% | 45.0% | 43.0% |
| CST General Mathematics Test | |||
| 2009 | 20.0% | 25.0% | 17.0% |
| 2008 | 11.0% | 19.0% | 18.0% |
| CST Biology Test | |||
| 2008 | 5.0% | 29.0% | 52.0% |
Grade 10 - % of students at or above proficiency
| School | District | State | |
|---|---|---|---|
| CST Algebra I Test | |||
| 2010 | 13.0% | 15.0% | 12.0% |
| 2009 | 9.0% | 15.0% | 11.0% |
| 2008 | 24.0% | 15.0% | 9.0% |
| CST Algebra II Test | |||
| 2010 | 77.0% | 59.0% | 40.0% |
| 2009 | 60.0% | 53.0% | 37.0% |
| 2008 | 64.0% | 51.0% | 36.0% |
| CST Biology Test | |||
| 2010 | 63.0% | 53.0% | 38.0% |
| 2009 | 22.0% | 31.0% | 34.0% |
| 2008 | 35.0% | 33.0% | 35.0% |
| CST Earth Science Test | |||
| 2010 | 9.0% | 21.0% | 29.0% |
| CST English-Language Arts Test | |||
| 2010 | 35.0% | 38.0% | 45.0% |
| 2009 | 29.0% | 37.0% | 44.0% |
| 2008 | 34.0% | 34.0% | 41.0% |
| CST Geometry Test | |||
| 2010 | 27.0% | 17.0% | 14.0% |
| 2009 | 24.0% | 13.0% | 14.0% |
| 2008 | 27.0% | 15.0% | 12.0% |
| CST Science Test | |||
| 2010 | 39.0% | 40.0% | 46.0% |
| 2009 | 27.0% | 35.0% | 44.0% |
| 2008 | 34.0% | 33.0% | 40.0% |
| CST World History Test | |||
| 2010 | 36.0% | 38.0% | 42.0% |
| 2009 | 25.0% | 30.0% | 38.0% |
| 2008 | 27.0% | 25.0% | 33.0% |
Grade 11 - % of students at or above proficiency
| School | District | State | |
|---|---|---|---|
| CST Algebra I Test | |||
| 2010 | 18.0% | 14.0% | 8.0% |
| 2009 | 9.0% | 10.0% | 8.0% |
| 2008 | 9.0% | 6.0% | 5.0% |
| CST Algebra II Test | |||
| 2010 | 24.0% | 24.0% | 14.0% |
| 2009 | 18.0% | 15.0% | 12.0% |
| 2008 | 17.0% | 12.0% | 11.0% |
| CST Biology Test | |||
| 2010 | 26.0% | 40.0% | 46.0% |
| 2009 | 28.0% | 32.0% | 41.0% |
| 2008 | 19.0% | 24.0% | 39.0% |
| CST Chemistry Test | |||
| 2010 | 36.0% | 23.0% | 30.0% |
| 2009 | 47.0% | 24.0% | 27.0% |
| 2008 | 42.0% | 19.0% | 25.0% |
| CST Earth Science Test | |||
| 2010 | 10.0% | 17.0% | 32.0% |
| 2009 | 18.0% | 14.0% | 26.0% |
| 2008 | 12.0% | 9.0% | 28.0% |
| CST English-Language Arts Test | |||
| 2010 | 28.0% | 33.0% | 42.0% |
| 2009 | 35.0% | 32.0% | 40.0% |
| 2008 | 26.0% | 26.0% | 37.0% |
| CST Geometry Test | |||
| 2010 | 7.0% | 6.0% | 6.0% |
| 2009 | 10.0% | 7.0% | 7.0% |
| 2008 | 5.0% | 6.0% | 6.0% |
| CST Summative High School Math Test | |||
| 2010 | 60.0% | 61.0% | 50.0% |
| 2009 | 63.0% | 50.0% | 47.0% |
| 2008 | 52.0% | 53.0% | 43.0% |
| CST U.S. History Test | |||
| 2010 | 30.0% | 36.0% | 45.0% |
| 2009 | 34.0% | 30.0% | 44.0% |
| 2008 | 25.0% | 27.0% | 38.0% |
End of Course - % of students at or above proficiency
| School | District | State | |
|---|---|---|---|
| CST Algebra I Test | |||
| 2010 | 19.0% | 20.0% | 31.0% |
| 2009 | 20.0% | 20.0% | 28.0% |
| 2008 | 28.0% | 20.0% | 25.0% |
| CST Algebra II Test | |||
| 2010 | 49.0% | 45.0% | 31.0% |
| 2009 | 36.0% | 36.0% | 28.0% |
| 2008 | 36.0% | 32.0% | 27.0% |
| CST Biology Test | |||
| 2010 | 53.0% | 43.0% | 46.0% |
| 2009 | 22.0% | 32.0% | 42.0% |
| 2008 | 31.0% | 30.0% | 42.0% |
| CST Chemistry Test | |||
| 2010 | 35.0% | 30.0% | 38.0% |
| 2009 | 46.0% | 34.0% | 36.0% |
| 2008 | 41.0% | 26.0% | 32.0% |
| CST Earth Science Test | |||
| 2010 | 33.0% | 36.0% | 33.0% |
| 2009 | 32.0% | 29.0% | 28.0% |
| 2008 | 27.0% | 35.0% | 28.0% |
| CST Geometry Test | |||
| 2010 | 28.0% | 25.0% | 27.0% |
| 2009 | 30.0% | 22.0% | 26.0% |
| 2008 | 23.0% | 23.0% | 24.0% |
| CST Summative High School Math Test | |||
| 2010 | 63.0% | 62.0% | 54.0% |
| 2009 | 64.0% | 53.0% | 50.0% |
| 2008 | 55.0% | 54.0% | 47.0% |
| CST World History Test | |||
| 2010 | 36.0% | 38.0% | 41.0% |
| 2009 | 24.0% | 29.0% | 38.0% |
| 2008 | 28.0% | 25.0% | 33.0% |
| CST General Mathematics Test | |||
| 2009 | 20.0% | 25.0% | 26.0% |
| 2008 | 11.0% | 19.0% | 27.0% |
Source: CA Department of Education 2009-2010
School Map and Similar Schools Nearby
Click to Activate Map of Nearby School Campuses
Private
Public
This School
Similar Schools Nearby
| Mountain View High School 9-12 | 1,866 Students | 1.5 miles away | Not Yet Rated | |
| South El Monte High School 9-12 | 1,664 Students | 2.1 miles away | Not Yet Rated | |
| Arroyo High School 9-12 | 2,245 Students | 2.2 miles away | Not Yet Rated | |
| Rosemead High School 9-12 | 2,050 Students | 2.5 miles away | ![]() 4 out of 5 | |
| Bassett High School 9-12 | 1,294 Students | 3.5 miles away | ![]() 3.5 out of 5 | |
| Gabrielino High School 9-12 | 1,768 Students | 3.5 miles away | Not Yet Rated | |
| Temple City High School 9-12 | 1,982 Students | 4.0 miles away | Not Yet Rated | |
| Arcadia High School 9-12 | 3,610 Students | 4.6 miles away | Not Yet Rated | |
| Mark Keppel High School 9-12 | 2,408 Students | 4.6 miles away | Not Yet Rated | |
| San Gabriel High School 9-12 | 2,429 Students | 4.7 miles away | Not Yet Rated | |
Compare This School To Nearby Schools ->
School Community Forum

Join a discussion about El Monte High School and talk to others in the community including students, parents, teachers, and administrators.
Popular Discussion Topics
- Admissions and Registration Questions (e.g. Dress Code and Discipline Policy)
- School Calendar and Upcoming Events (e.g. Graduation)
- After School Programs, Extracurricular Activities, and Athletics (e.g. Football)
- News and Announcements (e.g. Yearbook and Class Supply List Details)
- Graduate and Alumni Events (e.g. Organizing Class Reunions)
Navigation
Can't Find What You Are Looking For?
Rankings
Nearby Cities
Sponsored Links
K-12 Articles
Siblings and Individual Identity in High School
When the first day of high school looms in the near future, teens are both excited and anxious....
Asperger Syndrome: A Developmental Disorder on the Autism Spectrum
Asperger Syndrome, also known as Pervasive Developmental Disorder is on the high functioning end of...
Se Hablan Otras Idiomas?
In the late 1990s, the Salem-Keizer school district in Oregon began requiring every student in its...


