El Rancho High School
6501 South Passons Blvd, Pico Rivera, CA 90660 | (562) 801-5295
- Grades: 9-12
- Student Enrollment: 3,191

5 out of 5 | 1 Review
Find Old Friends From El Rancho High School
Use the form below to search for alumni from El Rancho High School.
School Description
School Summary and Highlights
- Enrolls 3,191 high school students from grades 9-12
- Ranks 862nd out of 1,197 high schools in CA.
- 2010 Overall School AYP Met Status: No
Additional Contact Information
- Mailing Address: 6501 South Passons Blvd., Pico Rivera, CA 90660
School District Details
- El Rancho Unified School District
- Per-Pupil Spending: $8,866
- Graduation Rate: 73.7%
- Dropout Rate: 1.7%
- Students Per Teacher: 22.8
- Enrolled Students: 10,551
Faculty Details and Student Enrollment
Students and Faculty
- Total Students Enrolled: 3,191
- Total Full Time "Equivalent" Teachers: 130.9
- Average Student-To-Teacher Ratio: 24.4
Students Gender Breakdown
- Males: 1,608 (50.4%)
- Females: 1,583 (49.6%)
Free Lunch Student Eligibility Breakdown
- Eligible for Reduced Lunch: 332 (10.4%)
- Eligible for Free Lunch: 1,342 (42.1%)
- Eligible for Either Reduced or Free Lunch: 1,674 (52.5%)
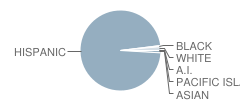
Student Enrollment Distribution by Race / Ethnicity

| Number | Percent | |
|---|---|---|
| American Indian | 3 | 0.09% |
| Black | 15 | 0.5% |
| Asian | 27 | 0.8% |
| Hispanic | 3,092 | 96.9% |
| White | 49 | 1.5% |
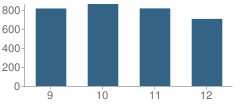
Number of Students Per Grade

| Number | Percent | |
|---|---|---|
| 9th Grade | 813 | 25.5% |
| 10th Grade | 860 | 27.0% |
| 11th Grade | 814 | 25.5% |
| 12th Grade | 704 | 22.1% |
Graduates Information (2010)
Graduation Rate
School:
93.6%
District:
90.2%
State:
78.6%
Teacher Education Background (2009)
Percent With Master's Degree
School:
29.1%
District:
46.4%
Percent With Bachelor's Degree
School:
33.8%
District:
21.4%
Teacher Credentials & Experience (2009)
Percent of Teachers With Emergency Credentials: 4.4%
Percent of Teachers With Credentials: 91.2%
Number of Certificated Staff: 151.0
Average Number of Years of Teacher Experience: 13.5
Average Age
School:
39.0
District:
40.7
Source: CA Department of Education, Source: NCES 2009-2010
Sponsored Links
Test Scores and Performance Information
Overall School Rating
How is this determined?
The overall school rating shows that El Rancho High School performed on average worse than many other schools across the state on CST state exams in the following subjects:
- CST Algebra I
- CST Algebra II
- CST Biology
- CST Chemistry
- CST Earth Science
- CST English-Language Arts
- CST General Mathematics
- CST Geometry
- CST Physics
- CST Science
- CST Summative High School Math
- CST U.S. History
- CST World History
AYP Results (2010)
Overall AYP Met: No
ELA AYP Met: No
Math AYP Met: No
ACT Exam Results (2009)
Percent of Students Taking ACT Exam: 17.1%
Average Combined Score: 18.4
Percent Scoring At or Above 21: 27.6%
SAT Exam Results (2009)
Percent of Students Taking SAT Exam: 54.2%
Average Combined Score: 1,263.2
Critical Reading Average: 416.9
Math Average: 426.4
Writing Average: 420.0
Percent Scoring At or Above 1500: 16.5%
CST - Test Proficiency by Grade and Subject
Grade 9 - % of students at or above proficiency
| School | District | State | |
|---|---|---|---|
| CST Algebra I Test | |||
| 2010 | 17.0% | 17.0% | 22.0% |
| 2009 | 28.0% | 27.0% | 21.0% |
| 2008 | 22.0% | 22.0% | 18.0% |
| CST Algebra II Test | |||
| 2010 | 71.0% | 71.0% | 69.0% |
| CST Biology Test | |||
| 2010 | 54.0% | 54.0% | 55.0% |
| 2009 | 45.0% | 45.0% | 51.0% |
| 2008 | 41.0% | 41.0% | 52.0% |
| CST Earth Science Test | |||
| 2010 | 10.0% | 10.0% | 35.0% |
| 2009 | 9.0% | 9.0% | 29.0% |
| 2008 | 9.0% | 9.0% | 31.0% |
| CST English-Language Arts Test | |||
| 2010 | 51.0% | 51.0% | 54.0% |
| 2009 | 41.0% | 40.0% | 50.0% |
| 2008 | 41.0% | 41.0% | 49.0% |
| CST Geometry Test | |||
| 2010 | 33.0% | 33.0% | 46.0% |
| 2009 | 40.0% | 40.0% | 47.0% |
| 2008 | 47.0% | 47.0% | 43.0% |
| CST General Mathematics Test | |||
| 2009 | 5.0% | 5.0% | 17.0% |
| 2008 | 7.0% | 7.0% | 18.0% |
| CST Chemistry Test | |||
| 2008 | 54.0% | 54.0% | 44.0% |
Grade 10 - % of students at or above proficiency
| School | District | State | |
|---|---|---|---|
| CST Algebra I Test | |||
| 2010 | 9.0% | 9.0% | 12.0% |
| 2009 | 9.0% | 9.0% | 11.0% |
| 2008 | 5.0% | 5.0% | 9.0% |
| CST Algebra II Test | |||
| 2010 | 28.0% | 28.0% | 40.0% |
| 2009 | 29.0% | 29.0% | 37.0% |
| 2008 | 38.0% | 38.0% | 36.0% |
| CST Biology Test | |||
| 2010 | 22.0% | 22.0% | 38.0% |
| 2009 | 20.0% | 20.0% | 34.0% |
| 2008 | 21.0% | 21.0% | 35.0% |
| CST Chemistry Test | |||
| 2010 | 19.0% | 19.0% | 47.0% |
| 2009 | 13.0% | 13.0% | 44.0% |
| 2008 | 8.0% | 8.0% | 41.0% |
| CST Earth Science Test | |||
| 2010 | 8.0% | 8.0% | 29.0% |
| 2009 | 10.0% | 10.0% | 23.0% |
| 2008 | 12.0% | 12.0% | 23.0% |
| CST English-Language Arts Test | |||
| 2010 | 35.0% | 34.0% | 45.0% |
| 2009 | 32.0% | 32.0% | 44.0% |
| 2008 | 31.0% | 31.0% | 41.0% |
| CST Geometry Test | |||
| 2010 | 15.0% | 15.0% | 14.0% |
| 2009 | 11.0% | 11.0% | 14.0% |
| 2008 | 12.0% | 12.0% | 12.0% |
| CST Science Test | |||
| 2010 | 37.0% | 36.0% | 46.0% |
| 2009 | 38.0% | 36.0% | 44.0% |
| 2008 | 34.0% | 35.0% | 40.0% |
| CST Summative High School Math Test | |||
| 2010 | 82.0% | 78.0% | 75.0% |
| CST World History Test | |||
| 2010 | 35.0% | 35.0% | 42.0% |
| 2009 | 32.0% | 31.0% | 38.0% |
| 2008 | 27.0% | 27.0% | 33.0% |
Grade 11 - % of students at or above proficiency
| School | District | State | |
|---|---|---|---|
| CST Algebra I Test | |||
| 2010 | 6.0% | 7.0% | 8.0% |
| 2009 | 4.0% | 4.0% | 8.0% |
| 2008 | 3.0% | 2.0% | 5.0% |
| CST Algebra II Test | |||
| 2010 | 7.0% | 7.0% | 14.0% |
| 2009 | 10.0% | 10.0% | 12.0% |
| 2008 | 6.0% | 6.0% | 11.0% |
| CST Biology Test | |||
| 2010 | 28.0% | 20.0% | 46.0% |
| 2009 | 53.0% | 28.0% | 41.0% |
| 2008 | 58.0% | 40.0% | 39.0% |
| CST Chemistry Test | |||
| 2010 | 8.0% | 8.0% | 30.0% |
| 2009 | 10.0% | 10.0% | 27.0% |
| 2008 | 2.0% | 2.0% | 25.0% |
| CST Earth Science Test | |||
| 2010 | 22.0% | 21.0% | 32.0% |
| 2009 | 8.0% | 8.0% | 26.0% |
| 2008 | 26.0% | 26.0% | 28.0% |
| CST English-Language Arts Test | |||
| 2010 | 33.0% | 29.0% | 42.0% |
| 2009 | 29.0% | 25.0% | 40.0% |
| 2008 | 28.0% | 26.0% | 37.0% |
| CST Geometry Test | |||
| 2010 | 6.0% | 6.0% | 6.0% |
| 2009 | 4.0% | 4.0% | 7.0% |
| 2008 | 6.0% | 6.0% | 6.0% |
| CST Physics Test | |||
| 2010 | 30.0% | 30.0% | 53.0% |
| 2009 | 10.0% | 10.0% | 50.0% |
| 2008 | 6.0% | 6.0% | 47.0% |
| CST Summative High School Math Test | |||
| 2010 | 22.0% | 22.0% | 50.0% |
| 2009 | 31.0% | 31.0% | 47.0% |
| 2008 | 31.0% | 31.0% | 43.0% |
| CST U.S. History Test | |||
| 2010 | 39.0% | 35.0% | 45.0% |
| 2009 | 40.0% | 36.0% | 44.0% |
| 2008 | 30.0% | 27.0% | 38.0% |
End of Course - % of students at or above proficiency
| School | District | State | |
|---|---|---|---|
| CST Algebra I Test | |||
| 2010 | 13.0% | 24.0% | 31.0% |
| 2009 | 15.0% | 23.0% | 28.0% |
| 2008 | 11.0% | 22.0% | 25.0% |
| CST Algebra II Test | |||
| 2010 | 23.0% | 23.0% | 31.0% |
| 2009 | 18.0% | 18.0% | 28.0% |
| 2008 | 21.0% | 21.0% | 27.0% |
| CST Biology Test | |||
| 2010 | 39.0% | 36.0% | 46.0% |
| 2009 | 34.0% | 31.0% | 42.0% |
| 2008 | 39.0% | 36.0% | 42.0% |
| CST Chemistry Test | |||
| 2010 | 14.0% | 14.0% | 38.0% |
| 2009 | 12.0% | 12.0% | 36.0% |
| 2008 | 8.0% | 8.0% | 32.0% |
| CST Earth Science Test | |||
| 2010 | 11.0% | 11.0% | 33.0% |
| 2009 | 10.0% | 10.0% | 28.0% |
| 2008 | 12.0% | 12.0% | 28.0% |
| CST Geometry Test | |||
| 2010 | 18.0% | 20.0% | 27.0% |
| 2009 | 19.0% | 22.0% | 26.0% |
| 2008 | 17.0% | 17.0% | 24.0% |
| CST Physics Test | |||
| 2010 | 30.0% | 30.0% | 49.0% |
| 2009 | 10.0% | 10.0% | 46.0% |
| 2008 | 6.0% | 6.0% | 43.0% |
| CST Summative High School Math Test | |||
| 2010 | 32.0% | 32.0% | 54.0% |
| 2009 | 31.0% | 31.0% | 50.0% |
| 2008 | 32.0% | 32.0% | 47.0% |
| CST World History Test | |||
| 2010 | 35.0% | 35.0% | 41.0% |
| 2009 | 31.0% | 30.0% | 38.0% |
| 2008 | 27.0% | 27.0% | 33.0% |
| CST General Mathematics Test | |||
| 2009 | 5.0% | 19.0% | 26.0% |
| 2008 | 7.0% | 23.0% | 27.0% |
Source: CA Department of Education 2009-2010
School Map and Similar Schools Nearby
Click to Activate Map of Nearby School Campuses
Private
Public
This School
Similar Schools Nearby
| Pioneer High School 9-12 | 1,492 Students | 1.0 miles away | Not Yet Rated | |
| Whittier High School 9-12 | 2,466 Students | 2.5 miles away | ![]() 5 out of 5 | |
| Montebello High School 9-12 | 3,491 Students | 3.0 miles away | ![]() 4.5 out of 5 | |
| Santa Fe High School 9-12 | 2,932 Students | 3.0 miles away | ![]() 5 out of 5 | |
| Schurr High School 9-12 | 3,548 Students | 3.8 miles away | ![]() 5 out of 5 | |
| Bell Gardens High School 9-12 | 3,570 Students | 3.9 miles away | Not Yet Rated | |
| Downey High School 9-12 | 4,016 Students | 3.9 miles away | Not Yet Rated | |
| California High School 9-12 | 2,935 Students | 4.5 miles away | ![]() 4 out of 5 | |
| Warren High School 9-12 | 3,666 Students | 4.6 miles away | ![]() 4 out of 5 | |
| James A. Garfield High School 9-12 | 4,271 Students | 5.0 miles away | ![]() 5 out of 5 | |
Compare This School To Nearby Schools ->
School Community Forum

Join a discussion about El Rancho High School and talk to others in the community including students, parents, teachers, and administrators.
Popular Discussion Topics
- Admissions and Registration Questions (e.g. Dress Code and Discipline Policy)
- School Calendar and Upcoming Events (e.g. Graduation)
- After School Programs, Extracurricular Activities, and Athletics (e.g. Football)
- News and Announcements (e.g. Yearbook and Class Supply List Details)
- Graduate and Alumni Events (e.g. Organizing Class Reunions)
Navigation
Can't Find What You Are Looking For?
Rankings
Nearby Cities
Sponsored Links
K-12 Articles
Cut the Credit and Save You Some Money
Today's society glorifies a get-it-now mentality. Children learn this early. You probably noticed...
Educators and Childhood Obesity
Obesity in childhood is rising to epidemic proportions in America and educators should be...
Changing Schools Isn't Easy: Tips for a Successful Transition
It isn't easy for students to make the transition into a new school, especially if they have...


(5 / 5) 

