Vincent Elementary School
Rating
Not Available
Not Available

No Reviews Yet
Find Old Friends From Vincent Elementary School
Use the form below to search for alumni from Vincent Elementary School.
School Description
School Summary and Highlights
- Enrolls 518 elementary school students from grades KG-6
- Ranks 156th out of 1,895 elementary schools in PA.
- 2010 Overall School AYP Met Status: Made AYP
Additional Contact Information
- Principal or Admin: Cheryl Bell
School District Details
- Owen J Roberts School District
- Per-Pupil Spending: $11,521
- Graduation Rate: 95.8%
- Students Per Teacher: 13.6
- Enrolled Students: 4,905
Faculty Details and Student Enrollment
Students and Faculty
- Total Students Enrolled: 518
- Total Full Time "Equivalent" Teachers: 36.3
- Average Student-To-Teacher Ratio: 14.3
Students Gender Breakdown
- Males: 282 (54.4%)
- Females: 234 (45.2%)
Free Lunch Student Eligibility Breakdown
- Eligible for Reduced Lunch: 10 (1.9%)
- Eligible for Free Lunch: 34 (6.6%)
- Eligible for Either Reduced or Free Lunch: 44 (8.5%)
Student Enrollment Distribution by Race / Ethnicity

| Number | Percent | |
|---|---|---|
| American Indian | 1 | 0.2% |
| Black | 8 | 1.5% |
| Asian | 14 | 2.7% |
| Hispanic | 3 | 0.6% |
| White | 490 | 94.6% |
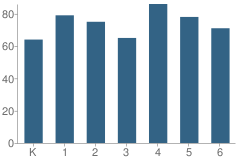
Number of Students Per Grade
| Number | Percent | |
|---|---|---|
| Kindergarten | 64 | 12.4% |
| 1st Grade | 79 | 15.3% |
| 2nd Grade | 75 | 14.5% |
| 3rd Grade | 65 | 12.5% |
| 4th Grade | 86 | 16.6% |
| 5th Grade | 78 | 15.1% |
| 6th Grade | 71 | 13.7% |
Low-Income Enrollment (2011)
Percent of Students from Low-Income Families
School:
5.2%
District:
11.0%
Source: PA Department of Education, Source: NCES 2009-2010
School Ratings and Reviews
Be The First To Review Vincent Elementary School!
School Map and Similar Schools Nearby
Click to Activate Map of Nearby School Campuses
Private
Public
This School
Similar Schools Nearby
| East Pikeland Elementary School 1-5 | 328 Students | 2.6 miles away | Not Yet Rated | |
| Spring City Elementary School KG-4 | 158 Students | 2.9 miles away | Not Yet Rated | |
| East Coventry Elementary School KG-6 | 551 Students | 3.0 miles away | Not Yet Rated | |
| Royersford Elementary School KG-4 | 442 Students | 3.8 miles away | Not Yet Rated | |
| Brooke Elementary School KG-4 | 410 Students | 4.1 miles away | Not Yet Rated | |
| French Creek Elementary School KG-6 | 526 Students | 4.5 miles away | Not Yet Rated | |
| North Coventry Elementary School KG-6 | 588 Students | 4.5 miles away | Not Yet Rated | |
| Spring-Ford Intermediate School 5th / 6th 5-6 | 1,189 Students | 5.1 miles away | Not Yet Rated | |
| Barkley Elementary School 1-5 | 367 Students | 5.3 miles away | Not Yet Rated | |
| Rupert Elementary School KG-5 | 281 Students | 5.3 miles away |  5 out of 5 | |
Compare This School To Nearby Schools ->
School Community Forum

Join a discussion about Vincent Elementary School and talk to others in the community including students, parents, teachers, and administrators.
Popular Discussion Topics
- Admissions and Registration Questions (e.g. Dress Code and Discipline Policy)
- School Calendar and Upcoming Events (e.g. Graduation)
- After School Programs, Extracurricular Activities, and Athletics (e.g. Football)
- News and Announcements (e.g. Yearbook and Class Supply List Details)
- Graduate and Alumni Events (e.g. Organizing Class Reunions)
Navigation
Can't Find What You Are Looking For?
Rankings
Nearby Cities
Sponsored Links
K-12 Articles

Bullies... What Are They Good For?
Bullies have been around since the beginning of time. We had to deal with bullies, and our parents...
Bullies have been around since the beginning of time. We had to deal with bullies, and our parents...

Homework Helps
School has started throughout the country and is well into the first month-some schools are...
School has started throughout the country and is well into the first month-some schools are...

Promoting Childhood Literacy
The number of American adults who are illiterate is astounding. People who lack the ability to read...
The number of American adults who are illiterate is astounding. People who lack the ability to read...