Marshall Thurgood School
Rating
Not Available
Not Available

No Reviews Yet
Find Old Friends From Marshall Thurgood School
Use the form below to search for alumni from Marshall Thurgood School.
School Description
School Summary and Highlights
- Enrolls 731 preschool and elementary school students from grades PK-8
- Ranks 663rd out of 875 middle schools in PA.
- 2010 Overall School AYP Met Status: Warning
Additional Contact Information
- Mailing Address: 5120 N 6th St, Philadelphia, PA 19120
- Principal or Admin: Jack Hamilton
School Operational Details
- Title I EligibleAll students of this school are eligible for participation in authorized programs.
School District Details
- Philadelphia City School District
- Per-Pupil Spending: $9,399
- Graduation Rate: 55.5%
- Dropout Rate: 8.5%
- Students Per Teacher: 14.3
- Enrolled Students: 156,790
Faculty Details and Student Enrollment
Students and Faculty
- Total Students Enrolled: 731
- Total Full Time "Equivalent" Teachers: 52.4
- Average Student-To-Teacher Ratio: 13.9
Students Gender Breakdown
- Males: 342 (46.8%)
- Females: 366 (50.1%)
Free Lunch Student Eligibility Breakdown
- Eligible for Reduced Lunch: - (-)
- Eligible for Free Lunch: 677 (92.6%)
- Eligible for Either Reduced or Free Lunch: 677 (92.6%)
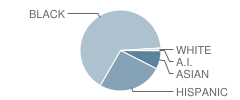
Student Enrollment Distribution by Race / Ethnicity
| Number | Percent | |
|---|---|---|
| American Indian | 1 | 0.1% |
| Black | 465 | 63.6% |
| Asian | 52 | 7.1% |
| Hispanic | 183 | 25.0% |
| White | 7 | 1.0% |
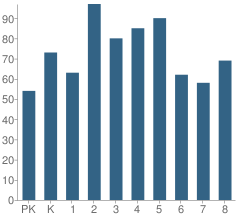
Number of Students Per Grade
| Number | Percent | |
|---|---|---|
| Pre-Kindergarten | 54 | 7.4% |
| Kindergarten | 73 | 10.0% |
| 1st Grade | 63 | 8.6% |
| 2nd Grade | 97 | 13.3% |
| 3rd Grade | 80 | 10.9% |
| 4th Grade | 85 | 11.6% |
| 5th Grade | 90 | 12.3% |
| 6th Grade | 62 | 8.5% |
| 7th Grade | 58 | 7.9% |
| 8th Grade | 69 | 9.4% |
Low-Income Enrollment (2011)
Percent of Students from Low-Income Families
School:
92.7%
District:
80.0%
Graduation and Dropout Rates (2010)
Dropout Rate
School:
0.8%
District:
4.1%
Source: PA Department of Education, Source: NCES 2009-2010
School Ratings and Reviews
Be The First To Review Marshall Thurgood School!
School Map and Similar Schools Nearby
Click to Activate Map of Nearby School Campuses
Private
Public
This School
Similar Schools Nearby
| Birney Gen Davis B School PK-8 | 605 Students | 0.2 miles away | Not Yet Rated | |
| Morrison Andrew J School KG-8 | 733 Students | 0.3 miles away | Not Yet Rated | |
| Cayuga School KG-5 | 433 Students | 0.5 miles away | Not Yet Rated | |
| Cooke Jay Middle School KG-8 | 434 Students | 0.6 miles away | Not Yet Rated | |
| Feltonville School 3-5 | 682 Students | 0.7 miles away | Not Yet Rated | |
| Olney Elementary School KG-8 | 804 Students | 0.7 miles away | Not Yet Rated | |
| Lowell James R School PK-4 | 965 Students | 0.9 miles away | Not Yet Rated | |
| Washington Grover Jr School 5-8 | 799 Students | 0.9 miles away | Not Yet Rated | |
| Howe Julia Ward School KG-5 | 293 Students | 0.9 miles away | Not Yet Rated | |
| Logan James School PK-6 | 466 Students | 0.9 miles away | Not Yet Rated | |
Compare This School To Nearby Schools ->
School Community Forum

Join a discussion about Marshall Thurgood School and talk to others in the community including students, parents, teachers, and administrators.
Popular Discussion Topics
- Admissions and Registration Questions (e.g. Dress Code and Discipline Policy)
- School Calendar and Upcoming Events (e.g. Graduation)
- After School Programs, Extracurricular Activities, and Athletics (e.g. Football)
- News and Announcements (e.g. Yearbook and Class Supply List Details)
- Graduate and Alumni Events (e.g. Organizing Class Reunions)
Navigation
Can't Find What You Are Looking For?
Rankings
Sponsored Links
K-12 Articles

Feeling Good in Your Own Skin
Body image is a very touchy issue with today’s kids. Since the 1950s, when Barbie was first...
Body image is a very touchy issue with today’s kids. Since the 1950s, when Barbie was first...

Idle Hands
The worst affliction affecting our kids today is not teen pregnancy, drugs and alcohol, or...
The worst affliction affecting our kids today is not teen pregnancy, drugs and alcohol, or...

School Violence: Can It Be Stopped
It’s a fact that violence in schools is prevalent in today’s society. We hear of school shootings,...
It’s a fact that violence in schools is prevalent in today’s society. We hear of school shootings,...