Dunbar Paul L School
Rating
Not Available
Not Available

No Reviews Yet
Find Old Friends From Dunbar Paul L School
Use the form below to search for alumni from Dunbar Paul L School.
School Description
School Summary and Highlights
- Enrolls 219 preschool and elementary school students from grades PK-8
- Ranks 819th out of 875 middle schools in PA.
- 2010 Overall School AYP Met Status: Corrective Action 2 (eighth year)
Additional Contact Information
- Mailing Address: 1750 N 12th St, Philadelphia, PA 19122
- Principal or Admin: Bea Mickey
School Operational Details
- Title I EligibleAll students of this school are eligible for participation in authorized programs.
School District Details
- Philadelphia City School District
- Per-Pupil Spending: $9,399
- Graduation Rate: 55.5%
- Dropout Rate: 8.5%
- Students Per Teacher: 14.3
- Enrolled Students: 156,790
Faculty Details and Student Enrollment
Students and Faculty
- Total Students Enrolled: 219
- Total Full Time "Equivalent" Teachers: 23.5
- Average Student-To-Teacher Ratio: 9.3
Students Gender Breakdown
- Males: 115 (52.5%)
- Females: 96 (43.8%)
Free Lunch Student Eligibility Breakdown
- Eligible for Reduced Lunch: - (-)
- Eligible for Free Lunch: 181 (82.6%)
- Eligible for Either Reduced or Free Lunch: 181 (82.6%)
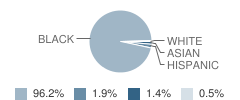
Student Enrollment Distribution by Race / Ethnicity
| Number | Percent | |
|---|---|---|
| American Indian | - | - |
| Black | 203 | 92.7% |
| Asian | 3 | 1.4% |
| Hispanic | 4 | 1.8% |
| White | 1 | 0.5% |
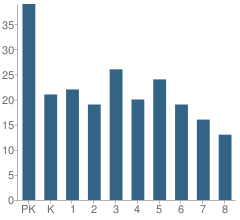
Number of Students Per Grade
| Number | Percent | |
|---|---|---|
| Pre-Kindergarten | 39 | 17.8% |
| Kindergarten | 21 | 9.6% |
| 1st Grade | 22 | 10.0% |
| 2nd Grade | 19 | 8.7% |
| 3rd Grade | 26 | 11.9% |
| 4th Grade | 20 | 9.1% |
| 5th Grade | 24 | 11.0% |
| 6th Grade | 19 | 8.7% |
| 7th Grade | 16 | 7.3% |
| 8th Grade | 13 | 5.9% |
Low-Income Enrollment (2011)
Percent of Students from Low-Income Families
School:
91.6%
District:
80.0%
Graduation and Dropout Rates (2010)
Dropout Rate
School:
3.4%
District:
4.1%
Source: PA Department of Education, Source: NCES 2009-2010
School Ratings and Reviews
Be The First To Review Dunbar Paul L School!
School Map and Similar Schools Nearby
Click to Activate Map of Nearby School Campuses
Private
Public
This School
Similar Schools Nearby
| Harrison William H School KG-8 | 210 Students | 0.5 miles away | Not Yet Rated | |
| Ferguson Joseph C School PK-8 | 462 Students | 0.5 miles away |  4 out of 5 | |
| Duckrey Tanner School PK-8 | 433 Students | 0.5 miles away | Not Yet Rated | |
| Meade Gen George C School PK-8 | 380 Students | 0.6 miles away |  5 out of 5 | |
| Ludlow James R School PK-8 | 280 Students | 0.6 miles away | Not Yet Rated | |
| Mckinley William School PK-8 | 336 Students | 0.7 miles away | Not Yet Rated | |
| Hartranft John F School PK-8 | 439 Students | 0.9 miles away | Not Yet Rated | |
| Douglass Frederick School PK-8 | 518 Students | 0.9 miles away | Not Yet Rated | |
| Welsh John School KG-8 | 592 Students | 0.9 miles away | Not Yet Rated | |
| Stanton M Hall School PK-8 | 476 Students | 0.9 miles away | Not Yet Rated | |
Compare This School To Nearby Schools ->
School Community Forum

Join a discussion about Dunbar Paul L School and talk to others in the community including students, parents, teachers, and administrators.
Popular Discussion Topics
- Admissions and Registration Questions (e.g. Dress Code and Discipline Policy)
- School Calendar and Upcoming Events (e.g. Graduation)
- After School Programs, Extracurricular Activities, and Athletics (e.g. Football)
- News and Announcements (e.g. Yearbook and Class Supply List Details)
- Graduate and Alumni Events (e.g. Organizing Class Reunions)
Navigation
Can't Find What You Are Looking For?
Rankings
Sponsored Links
K-12 Articles

Feeling Good in Your Own Skin
Body image is a very touchy issue with today’s kids. Since the 1950s, when Barbie was first...
Body image is a very touchy issue with today’s kids. Since the 1950s, when Barbie was first...

Preparing Your Child for the First Day of School
It seems like school was just dismissed for the summer, yet here we are facing another year of back...
It seems like school was just dismissed for the summer, yet here we are facing another year of back...

Teaching Kids to Deal with Peer Pressure
Parents usually become very concerned when they hear the term “peer pressure.” However, peer...
Parents usually become very concerned when they hear the term “peer pressure.” However, peer...