Ludlow James R School
Rating
Not Available
Not Available

No Reviews Yet
Find Old Friends From Ludlow James R School
Use the form below to search for alumni from Ludlow James R School.
School Description
School Summary and Highlights
- Enrolls 280 preschool and elementary school students from grades PK-8
- Ranks 533rd out of 875 middle schools in PA.
- 2010 Overall School AYP Met Status: Making Progress in Corrective Action 2 (fourth year)
Additional Contact Information
- Mailing Address: 550 W Master St, Philadelphia, PA 19122
- Principal or Admin: Charlotte Buonassisi
School Operational Details
- Title I EligibleAll students of this school are eligible for participation in authorized programs.
School District Details
- Philadelphia City School District
- Per-Pupil Spending: $9,399
- Graduation Rate: 55.5%
- Dropout Rate: 8.5%
- Students Per Teacher: 14.3
- Enrolled Students: 156,790
Faculty Details and Student Enrollment
Students and Faculty
- Total Students Enrolled: 280
- Total Full Time "Equivalent" Teachers: 29.2
- Average Student-To-Teacher Ratio: 9.6
Students Gender Breakdown
- Males: 153 (54.6%)
- Females: 113 (40.4%)
Free Lunch Student Eligibility Breakdown
- Eligible for Reduced Lunch: - (-)
- Eligible for Free Lunch: 263 (93.9%)
- Eligible for Either Reduced or Free Lunch: 263 (93.9%)
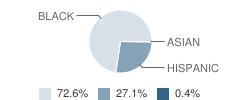
Student Enrollment Distribution by Race / Ethnicity
| Number | Percent | |
|---|---|---|
| American Indian | - | - |
| Black | 193 | 68.9% |
| Asian | 1 | 0.4% |
| Hispanic | 72 | 25.7% |
| White | - | - |
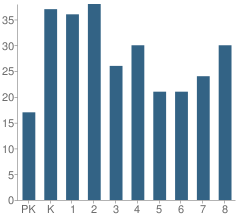
Number of Students Per Grade
| Number | Percent | |
|---|---|---|
| Pre-Kindergarten | 17 | 6.1% |
| Kindergarten | 37 | 13.2% |
| 1st Grade | 36 | 12.9% |
| 2nd Grade | 38 | 13.6% |
| 3rd Grade | 26 | 9.3% |
| 4th Grade | 30 | 10.7% |
| 5th Grade | 21 | 7.5% |
| 6th Grade | 21 | 7.5% |
| 7th Grade | 24 | 8.6% |
| 8th Grade | 30 | 10.7% |
Low-Income Enrollment (2011)
Percent of Students from Low-Income Families
School:
100.0%
District:
80.0%
Source: PA Department of Education, Source: NCES 2009-2010
School Ratings and Reviews
Be The First To Review Ludlow James R School!
School Map and Similar Schools Nearby
Click to Activate Map of Nearby School Campuses
Private
Public
This School
Similar Schools Nearby
| Harrison William H School KG-8 | 210 Students | 0.4 miles away | Not Yet Rated | |
| Moffet John School KG-5 | 420 Students | 0.5 miles away | Not Yet Rated | |
| Dunbar Paul L School PK-8 | 219 Students | 0.6 miles away | Not Yet Rated | |
| Ferguson Joseph C School PK-8 | 462 Students | 0.6 miles away |  4 out of 5 | |
| Kearny Gen Philip School KG-8 | 434 Students | 0.6 miles away | Not Yet Rated | |
| Mckinley William School PK-8 | 336 Students | 0.7 miles away | Not Yet Rated | |
| Spring Garden School KG-8 | 298 Students | 0.8 miles away | Not Yet Rated | |
| Adaire Alexander School KG-8 | 438 Students | 0.9 miles away | 4 out of 5 | |
| Penn Treaty Middle School 5-8 | 500 Students | 0.9 miles away | Not Yet Rated | |
| Welsh John School KG-8 | 592 Students | 1.0 miles away | Not Yet Rated | |
Compare This School To Nearby Schools ->
School Community Forum

Join a discussion about Ludlow James R School and talk to others in the community including students, parents, teachers, and administrators.
Popular Discussion Topics
- Admissions and Registration Questions (e.g. Dress Code and Discipline Policy)
- School Calendar and Upcoming Events (e.g. Graduation)
- After School Programs, Extracurricular Activities, and Athletics (e.g. Football)
- News and Announcements (e.g. Yearbook and Class Supply List Details)
- Graduate and Alumni Events (e.g. Organizing Class Reunions)
Navigation
Can't Find What You Are Looking For?
Rankings
Sponsored Links
K-12 Articles

The Most Used Form of Communication
Writing has, quite surprisingly, become more and more important in today's electronic society....
Writing has, quite surprisingly, become more and more important in today's electronic society....

Transform Your Middle School Slacker into a Scholar
All children need motivation to learn. Have your child's grades decreased since he started middle...
All children need motivation to learn. Have your child's grades decreased since he started middle...

Summer Advice
A few weeks ago, at the weekly after-school program I run through my local church, a group of...
A few weeks ago, at the weekly after-school program I run through my local church, a group of...