Olney Elementary School
Rating
Not Available
Not Available

No Reviews Yet
Find Old Friends From Olney Elementary School
Use the form below to search for alumni from Olney Elementary School.
School Description
School Summary and Highlights
- Enrolls 804 elementary school students from grades KG-8
- Ranks 694th out of 875 middle schools in PA.
- 2010 Overall School AYP Met Status: Made AYP
Additional Contact Information
- Mailing Address: 5301 N Water St, Philadelphia, PA 19120
- Principal or Admin: Henry Barsky
School Operational Details
- Title I EligibleAll students of this school are eligible for participation in authorized programs.
School District Details
- Philadelphia City School District
- Per-Pupil Spending: $9,399
- Graduation Rate: 55.5%
- Dropout Rate: 8.5%
- Students Per Teacher: 14.3
- Enrolled Students: 156,790
Faculty Details and Student Enrollment
Students and Faculty
- Total Students Enrolled: 804
- Total Full Time "Equivalent" Teachers: 50.4
- Average Student-To-Teacher Ratio: 16.0
Students Gender Breakdown
- Males: 416 (51.7%)
- Females: 359 (44.7%)
Free Lunch Student Eligibility Breakdown
- Eligible for Reduced Lunch: - (-)
- Eligible for Free Lunch: 801 (99.6%)
- Eligible for Either Reduced or Free Lunch: 801 (99.6%)
Student Enrollment Distribution by Race / Ethnicity
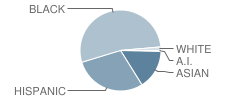
| Number | Percent | |
|---|---|---|
| American Indian | 3 | 0.4% |
| Black | 413 | 51.4% |
| Asian | 122 | 15.2% |
| Hispanic | 226 | 28.1% |
| White | 11 | 1.4% |
Number of Students Per Grade
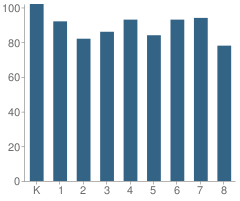
| Number | Percent | |
|---|---|---|
| Kindergarten | 102 | 12.7% |
| 1st Grade | 92 | 11.4% |
| 2nd Grade | 82 | 10.2% |
| 3rd Grade | 86 | 10.7% |
| 4th Grade | 93 | 11.6% |
| 5th Grade | 84 | 10.4% |
| 6th Grade | 93 | 11.6% |
| 7th Grade | 94 | 11.7% |
| 8th Grade | 78 | 9.7% |
Low-Income Enrollment (2011)
Percent of Students from Low-Income Families
School:
100.0%
District:
80.0%
Source: PA Department of Education, Source: NCES 2009-2010
School Ratings and Reviews
Be The First To Review Olney Elementary School!
School Map and Similar Schools Nearby
Click to Activate Map of Nearby School Campuses
Private
Public
This School
Similar Schools Nearby
| Washington Grover Jr School 5-8 | 799 Students | 0.3 miles away | Not Yet Rated | |
| Feltonville School 3-5 | 682 Students | 0.4 miles away | Not Yet Rated | |
| Morrison Andrew J School KG-8 | 733 Students | 0.4 miles away | Not Yet Rated | |
| Marshall Thurgood School PK-8 | 731 Students | 0.7 miles away | Not Yet Rated | |
| Barton Clara School PK-2 | 682 Students | 0.8 miles away | Not Yet Rated | - |
| Lowell James R School PK-4 | 965 Students | 0.8 miles away | Not Yet Rated | |
| Cayuga School KG-5 | 433 Students | 0.8 miles away | Not Yet Rated | |
| Creighton Thomas School KG-8 | 792 Students | 0.9 miles away | Not Yet Rated | |
| Finletter Thomas K School KG-8 | 859 Students | 0.9 miles away | Not Yet Rated | |
| Birney Gen Davis B School PK-8 | 605 Students | 0.9 miles away | Not Yet Rated | |
Compare This School To Nearby Schools ->
School Community Forum

Join a discussion about Olney Elementary School and talk to others in the community including students, parents, teachers, and administrators.
Popular Discussion Topics
- Admissions and Registration Questions (e.g. Dress Code and Discipline Policy)
- School Calendar and Upcoming Events (e.g. Graduation)
- After School Programs, Extracurricular Activities, and Athletics (e.g. Football)
- News and Announcements (e.g. Yearbook and Class Supply List Details)
- Graduate and Alumni Events (e.g. Organizing Class Reunions)
Navigation
Can't Find What You Are Looking For?
Rankings
Nearby Cities
Sponsored Links
K-12 Articles

Teaching Children a Love of History
Parents and grandparents are responsible for teaching children a love of history. To begin, relate...
Parents and grandparents are responsible for teaching children a love of history. To begin, relate...

Internet Safety for Kids of All Ages
Kids are being introduced to the Internet at a very young age. Research for homework and school...
Kids are being introduced to the Internet at a very young age. Research for homework and school...

Halloween Safety Tips
Ghosts and witches sit beside mistletoe and tinsel on store shelves. Orange and black deck the...
Ghosts and witches sit beside mistletoe and tinsel on store shelves. Orange and black deck the...