Hill Leslie P School
Rating
Not Available
Not Available

1 out of 5 | 1 Review
Find Old Friends From Hill Leslie P School
Use the form below to search for alumni from Hill Leslie P School.
School Description
School Summary and Highlights
- Enrolls 382 preschool and elementary school students from grades PK-8
- Ranks 869th out of 875 middle schools in PA.
- 2010 Overall School AYP Met Status: Warning
Additional Contact Information
- Principal or Admin: Tamara Thomas Smith
School Operational Details
- Title I EligibleAll students of this school are eligible for participation in authorized programs.
School District Details
- Philadelphia City School District
- Per-Pupil Spending: $9,399
- Graduation Rate: 55.5%
- Dropout Rate: 8.5%
- Students Per Teacher: 14.3
- Enrolled Students: 156,790
Faculty Details and Student Enrollment
Students and Faculty
- Total Students Enrolled: 382
- Total Full Time "Equivalent" Teachers: 27.0
- Average Student-To-Teacher Ratio: 14.2
Students Gender Breakdown
- Males: 203 (53.1%)
- Females: 178 (46.6%)
Free Lunch Student Eligibility Breakdown
- Eligible for Reduced Lunch: - (-)
- Eligible for Free Lunch: 309 (80.9%)
- Eligible for Either Reduced or Free Lunch: 309 (80.9%)
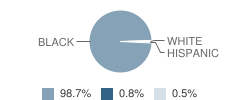
Student Enrollment Distribution by Race / Ethnicity
| Number | Percent | |
|---|---|---|
| American Indian | - | - |
| Black | 376 | 98.4% |
| Asian | - | - |
| Hispanic | 3 | 0.8% |
| White | 2 | 0.5% |
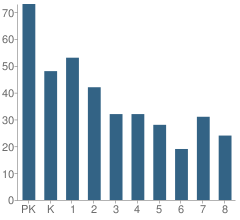
Number of Students Per Grade
| Number | Percent | |
|---|---|---|
| Pre-Kindergarten | 73 | 19.1% |
| Kindergarten | 48 | 12.6% |
| 1st Grade | 53 | 13.9% |
| 2nd Grade | 42 | 11.0% |
| 3rd Grade | 32 | 8.4% |
| 4th Grade | 32 | 8.4% |
| 5th Grade | 28 | 7.3% |
| 6th Grade | 19 | 5.0% |
| 7th Grade | 31 | 8.1% |
| 8th Grade | 24 | 6.3% |
Low-Income Enrollment (2011)
Percent of Students from Low-Income Families
School:
100.0%
District:
80.0%
Graduation and Dropout Rates (2010)
Dropout Rate
School:
1.8%
District:
4.1%
Source: PA Department of Education, Source: NCES 2009-2010
School Ratings and Reviews
Overall Rating: 1

1 out of 5 | 1 Review
The Overall Rating is the school's average rating from parents, students, school faculty and staff. The highest rating is five apples and the lowest is one apple.
Share Your Review About This School
1 review for Hill Leslie P School
- Reviewed by Parent/Guardian on March 30, 2009
- Rating:
 (1 / 5) Flag as inappropriate
 - This school needs to get some city year people in there because the children their have big issue with picking on children,my children are new kids on the block and since they have been going their they have been picked with every day for the last 2 weeks and they have only been going their for 3 weeks and already I'm ready to get them out of there.
School Map and Similar Schools Nearby
Click to Activate Map of Nearby School Campuses
Private
Public
This School
Similar Schools Nearby
| Blaine James G School PK-8 | 327 Students | 0.3 miles away | Not Yet Rated | |
| Wright Richard R School PK-6 | 429 Students | 0.4 miles away | Not Yet Rated | |
| Gideon Edward School PK-8 | 397 Students | 0.4 miles away | Not Yet Rated | |
| Allen Dr Ethel School PK-6 | 383 Students | 0.5 miles away | Not Yet Rated | |
| Dick William School PK-8 | 302 Students | 0.6 miles away | Not Yet Rated | |
| Kelley William D School PK-8 | 310 Students | 0.7 miles away | Not Yet Rated | |
| Pratt Anna B School PK-6 | 421 Students | 0.8 miles away | Not Yet Rated | |
| Douglass Frederick School PK-8 | 518 Students | 0.9 miles away | Not Yet Rated | |
| Whittier John G School KG-6 | 467 Students | 0.9 miles away |  5 out of 5 | |
| Reynolds Gen John F School PK-8 | 425 Students | 1.0 miles away | Not Yet Rated | |
Compare This School To Nearby Schools ->
School Community Forum

Join a discussion about Hill Leslie P School and talk to others in the community including students, parents, teachers, and administrators.
Popular Discussion Topics
- Admissions and Registration Questions (e.g. Dress Code and Discipline Policy)
- School Calendar and Upcoming Events (e.g. Graduation)
- After School Programs, Extracurricular Activities, and Athletics (e.g. Football)
- News and Announcements (e.g. Yearbook and Class Supply List Details)
- Graduate and Alumni Events (e.g. Organizing Class Reunions)
Navigation
Can't Find What You Are Looking For?
Rankings
Sponsored Links
K-12 Articles

Homework Tips: Taking the Work out of Homework
Kids hate homework. It seems that almost every night of the week they are overloaded with...
Kids hate homework. It seems that almost every night of the week they are overloaded with...

What to Do when Your Student is Held Back
Kids develop at different speeds, and everyone has different skills and abilities. School is easy...
Kids develop at different speeds, and everyone has different skills and abilities. School is easy...

Beating the Summer Slump
“The Summer Slump”, teachers call it. It happens every year. It makes its way into lesson plans...
“The Summer Slump”, teachers call it. It happens every year. It makes its way into lesson plans...