Longstreth William C School
Rating
Not Available
Not Available

4 out of 5 | 1 Review
Find Old Friends From Longstreth William C School
Use the form below to search for alumni from Longstreth William C School.
School Description
School Summary and Highlights
- Enrolls 539 preschool and elementary school students from grades PK-8
- Ranks 763rd out of 875 middle schools in PA.
- 2010 Overall School AYP Met Status: Made AYP
Additional Contact Information
- Principal or Admin: Robin Cooper
School Operational Details
- Title I EligibleAll students of this school are eligible for participation in authorized programs.
School District Details
- Philadelphia City School District
- Per-Pupil Spending: $9,399
- Graduation Rate: 55.5%
- Dropout Rate: 8.5%
- Students Per Teacher: 14.3
- Enrolled Students: 156,790
Faculty Details and Student Enrollment
Students and Faculty
- Total Students Enrolled: 539
- Total Full Time "Equivalent" Teachers: 33.1
- Average Student-To-Teacher Ratio: 16.3
Students Gender Breakdown
- Males: 270 (50.1%)
- Females: 264 (49.0%)
Free Lunch Student Eligibility Breakdown
- Eligible for Reduced Lunch: - (-)
- Eligible for Free Lunch: 502 (93.1%)
- Eligible for Either Reduced or Free Lunch: 502 (93.1%)
Student Enrollment Distribution by Race / Ethnicity
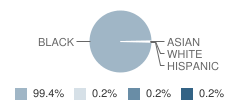
| Number | Percent | |
|---|---|---|
| American Indian | - | - |
| Black | 531 | 98.5% |
| Asian | 1 | 0.2% |
| Hispanic | 1 | 0.2% |
| White | 1 | 0.2% |
Number of Students Per Grade
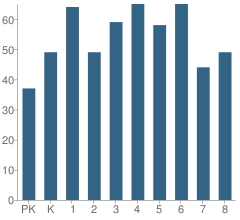
| Number | Percent | |
|---|---|---|
| Pre-Kindergarten | 37 | 6.9% |
| Kindergarten | 49 | 9.1% |
| 1st Grade | 64 | 11.9% |
| 2nd Grade | 49 | 9.1% |
| 3rd Grade | 59 | 10.9% |
| 4th Grade | 65 | 12.1% |
| 5th Grade | 58 | 10.8% |
| 6th Grade | 65 | 12.1% |
| 7th Grade | 44 | 8.2% |
| 8th Grade | 49 | 9.1% |
Low-Income Enrollment (2011)
Percent of Students from Low-Income Families
School:
100.0%
District:
80.0%
Source: PA Department of Education, Source: NCES 2009-2010
School Ratings and Reviews
Overall Rating: 4

4 out of 5 | 1 Review
The Overall Rating is the school's average rating from parents, students, school faculty and staff. The highest rating is five apples and the lowest is one apple.
Share Your Review About This School
1 review for Longstreth William C School
- Reviewed by Student on February 25, 2010
- Rating:
 (4 / 5) Flag as inappropriate
 - great school!
School Map and Similar Schools Nearby
Click to Activate Map of Nearby School Campuses
Private
Public
This School
Similar Schools Nearby
| Harrington Avery D School KG-6 | 441 Students | 0.5 miles away | Not Yet Rated | |
| Harrity William F School PK-8 | 662 Students | 0.5 miles away | Not Yet Rated | |
| Mitchell Elementary School PK-5 | 543 Students | 0.6 miles away | Not Yet Rated | |
| Anderson Add B School KG-8 | 532 Students | 0.7 miles away | Not Yet Rated | |
| Comegys Benjamin B School PK-6 | 593 Students | 0.9 miles away |  4 out of 5 | |
| Huey Samuel B School KG-8 | 740 Students | 0.9 miles away |  1 out of 5 | |
| Bryant William C School PK-8 | 577 Students | 1.0 miles away | Not Yet Rated | |
| Catharine Joseph School PK-5 | 611 Students | 1.0 miles away | Not Yet Rated | |
| Hamilton Andrew School KG-8 | 617 Students | 1.0 miles away | Not Yet Rated | |
| W B Evans Magnet School KG-6 | 366 Students | 1.1 miles away | Not Yet Rated | |
Compare This School To Nearby Schools ->
School Community Forum

Join a discussion about Longstreth William C School and talk to others in the community including students, parents, teachers, and administrators.
Popular Discussion Topics
- Admissions and Registration Questions (e.g. Dress Code and Discipline Policy)
- School Calendar and Upcoming Events (e.g. Graduation)
- After School Programs, Extracurricular Activities, and Athletics (e.g. Football)
- News and Announcements (e.g. Yearbook and Class Supply List Details)
- Graduate and Alumni Events (e.g. Organizing Class Reunions)
Navigation
Can't Find What You Are Looking For?
Rankings
Nearby Cities
Sponsored Links
K-12 Articles

Does Your Child's Teacher Make a Difference
School improvement is always in the news. Teachers demand smaller class sizes. The government calls...
School improvement is always in the news. Teachers demand smaller class sizes. The government calls...

Summer Reading
In 1998, a book was published in the US that turned a hatred of reading to love. “Harry Potter and...
In 1998, a book was published in the US that turned a hatred of reading to love. “Harry Potter and...

Asperger Syndrome: A Developmental Disorder on the Autism Spectrum
Asperger Syndrome, also known as Pervasive Developmental Disorder is on the high functioning end of...
Asperger Syndrome, also known as Pervasive Developmental Disorder is on the high functioning end of...