Fillmore Middle School
Rating
Not Available
Not Available

2 out of 5 | 1 Review
Find Old Friends From Fillmore Middle School
Use the form below to search for alumni from Fillmore Middle School.
School Description
School Summary and Highlights
- Enrolls 804 middle school students from grades 6-8
- Ranks 1550th out of 2,050 middle schools in CA.
- 2010 Overall School AYP Met Status: No
Additional Contact Information
- Mailing Address: PO Box 697, Fillmore, CA 93016
School Operational Details
- Title I EligibleAll students of this school are eligible for participation in authorized programs.
School District Details
- Fillmore Unified School District
- Per-Pupil Spending: $9,164
- Graduation Rate: 77.0%
- Dropout Rate: 2.4%
- Students Per Teacher: 22.1
- Enrolled Students: 3,855
Faculty Details and Student Enrollment
Students and Faculty
- Total Students Enrolled: 804
- Total Full Time "Equivalent" Teachers: 31.8
- Average Student-To-Teacher Ratio: 25.3
Students Gender Breakdown
- Males: 427 (53.1%)
- Females: 377 (46.9%)
Free Lunch Student Eligibility Breakdown
- Eligible for Reduced Lunch: 79 (9.8%)
- Eligible for Free Lunch: 520 (64.7%)
- Eligible for Either Reduced or Free Lunch: 599 (74.5%)
Student Enrollment Distribution by Race / Ethnicity
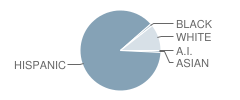
| Number | Percent | |
|---|---|---|
| American Indian | 1 | 0.1% |
| Black | 7 | 0.9% |
| Asian | 5 | 0.6% |
| Hispanic | 706 | 87.8% |
| White | 85 | 10.6% |
Number of Students Per Grade
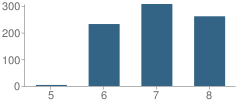
| Number | Percent | |
|---|---|---|
| 5th Grade | 4 | 0.5% |
| 6th Grade | 232 | 28.9% |
| 7th Grade | 307 | 38.2% |
| 8th Grade | 261 | 32.5% |
Teacher Education Background (2009)
Percent With Ph.D.: 4.9%
Percent With Master's Degree
School:
24.4%
District:
40.0%
Percent With Bachelor's Degree
School:
7.3%
District:
6.7%
Teacher Credentials & Experience (2009)
Percent of Teachers With Credentials: 100.0%
Number of Certificated Staff: 41.0
Average Number of Years of Teacher Experience: 13.9
Average Age
School:
44.0
District:
46.9
Source: CA Department of Education, Source: NCES 2009-2010
School Ratings and Reviews
Overall Rating: 2

2 out of 5 | 1 Review
The Overall Rating is the school's average rating from parents, students, school faculty and staff. The highest rating is five apples and the lowest is one apple.
Share Your Review About This School
1 review for Fillmore Middle School
- Reviewed by Parent/Guardian on May 18, 2007
- Rating:
 (2 / 5) Flag as inappropriate
 - Just to let you know, the middle school does not have lockers for 6th grade students to put their books and other items in. They either bring home all books or leave them at school and take a chance that they are still there the next day. Things do seem to disappear quite often. Also, the office does not like the students to use the office phone to call home. Sometimes my grandson gets out earlier than the scheduled time so he needs to call me or wait 45 minutes. They are not allowed to have cell phones at school (a lot of students ignore this rule), and they do not have pay phones on campus.
School Map and Similar Schools Nearby
Click to Activate Map of Nearby School Campuses
Private
Public
This School
Similar Schools Nearby
| Santa Clara Elementary School KG-6 | 56 Students | 5.0 miles away | Not Yet Rated | - |
| Piru Elementary School KG-6 | 348 Students | 6.9 miles away | Not Yet Rated | |
| Chaparral Middle School 6-8 | 848 Students | 8.4 miles away | Not Yet Rated | |
| Mupu Elementary School KG-8 | 132 Students | 8.8 miles away | Not Yet Rated | |
| Isbell Middle School 6-8 | 1,088 Students | 9.3 miles away |  5 out of 5 | |
| Mesa Verde Middle School 6-8 | 812 Students | 9.6 miles away | Not Yet Rated | |
| Somis Elementary School KG-8 | 301 Students | 10.9 miles away | Not Yet Rated | |
| Santa Rosa Technology Magnet School KG-8 | 557 Students | 11.1 miles away | Not Yet Rated | |
| Arroyo Elementary School KG-6 | 284 Students | 11.4 miles away | Not Yet Rated | |
| Briggs Elementary School 4-8 | 258 Students | 11.8 miles away | Not Yet Rated | |
Compare This School To Nearby Schools ->
School Community Forum

Join a discussion about Fillmore Middle School and talk to others in the community including students, parents, teachers, and administrators.
Popular Discussion Topics
- Admissions and Registration Questions (e.g. Dress Code and Discipline Policy)
- School Calendar and Upcoming Events (e.g. Graduation)
- After School Programs, Extracurricular Activities, and Athletics (e.g. Football)
- News and Announcements (e.g. Yearbook and Class Supply List Details)
- Graduate and Alumni Events (e.g. Organizing Class Reunions)
Navigation
Can't Find What You Are Looking For?
Rankings
Nearby Cities
Sponsored Links
K-12 Articles

Cutting Class
Depression is a very real problem for today's youth. When your spirit doesn't feel good, a lot of...
Depression is a very real problem for today's youth. When your spirit doesn't feel good, a lot of...

Internet Safety for Kids of All Ages
Kids are being introduced to the Internet at a very young age. Research for homework and school...
Kids are being introduced to the Internet at a very young age. Research for homework and school...

It's the Most Wonderful Time of the Year!
For most of the country, school is starting up this week or later this month-at the beginning of...
For most of the country, school is starting up this week or later this month-at the beginning of...