John Sutter Middle School
Rating
Not Available
Not Available

5 out of 5 | 3 Reviews
Find Old Friends From John Sutter Middle School
Use the form below to search for alumni from John Sutter Middle School.
School Description
School Summary and Highlights
- Enrolls 495 middle school students from grades 6-8
- Ranks 1528th out of 2,050 middle schools in CA.
- 2010 Overall School AYP Met Status: No
School Operational Details
- Title I Eligible
School District Details
- Fowler Unified School District
- Per-Pupil Spending: $8,611
- Graduation Rate: 83.8%
- Students Per Teacher: 21.6
- Enrolled Students: 2,347
Faculty Details and Student Enrollment
Students and Faculty
- Total Students Enrolled: 495
- Total Full Time "Equivalent" Teachers: 21.7
- Average Student-To-Teacher Ratio: 22.8
Students Gender Breakdown
- Males: 255 (51.5%)
- Females: 240 (48.5%)
Free Lunch Student Eligibility Breakdown
- Eligible for Reduced Lunch: 54 (10.9%)
- Eligible for Free Lunch: 301 (60.8%)
- Eligible for Either Reduced or Free Lunch: 355 (71.7%)
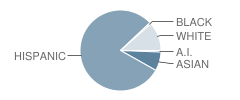
Student Enrollment Distribution by Race / Ethnicity
| Number | Percent | |
|---|---|---|
| American Indian | 3 | 0.6% |
| Black | 3 | 0.6% |
| Asian | 37 | 7.5% |
| Hispanic | 391 | 79.0% |
| White | 56 | 11.3% |
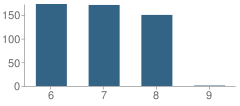
Number of Students Per Grade
| Number | Percent | |
|---|---|---|
| 6th Grade | 173 | 34.9% |
| 7th Grade | 171 | 34.5% |
| 8th Grade | 150 | 30.3% |
| 9th Grade | 1 | 0.2% |
Teacher Education Background (2009)
Percent With Master's Degree: 23.1%
Teacher Credentials & Experience (2009)
Percent of Teachers With Credentials: 100.0%
Number of Certificated Staff: 26.0
Average Number of Years of Teacher Experience: 13.4
Average Age
School:
40.2
District:
56.0
Source: CA Department of Education, Source: NCES 2009-2010
School Ratings and Reviews
Overall Rating: 5

5 out of 5 | 3 Reviews
The Overall Rating is the school's average rating from parents, students, school faculty and staff. The highest rating is five apples and the lowest is one apple.
Share Your Review About This School
3 reviews for John Sutter Middle School
- Reviewed by Student on February 05, 2009
- Rating:
 (5 / 5) Flag as inappropriate
 - hi my name is jaylynn and i love this school. it's the best school ever!!!!!!!!!!!!!!
- Reviewed by Student on July 15, 2007
- Rating: (5 / 5) Flag as inappropriate
- This is the best school I've ever been to.
- Reviewed by Student on July 15, 2007
- Rating: (5 / 5) Flag as inappropriate
- This is a good school, I believe. I felt like home coming to this school, because of how the students and staff treat you.
School Map and Similar Schools Nearby
Click to Activate Map of Nearby School Campuses
Private
Public
This School
Similar Schools Nearby
| Del Rey Elementary School KG-6 | 269 Students | 4.4 miles away | Not Yet Rated | |
| Andrew Jackson Elementary School KG-6 | 698 Students | 4.5 miles away |  5 out of 5 | |
| Lone Star Elementary School KG-6 | 560 Students | 4.8 miles away | Not Yet Rated | |
| Abraham Lincoln Middle School 7-8 | 933 Students | 4.9 miles away | Not Yet Rated | |
| Pacific Union Elementary School KG-8 | 361 Students | 5.1 miles away | Not Yet Rated | |
| Theodore Roosevelt Elementary School KG-6 | 753 Students | 5.1 miles away | Not Yet Rated | |
| James Garfield Elementary School KG-6 | 265 Students | 5.3 miles away | 5 out of 5 | |
| Eric White Elementary School 2-6 | 482 Students | 5.4 miles away | Not Yet Rated | |
| Woodrow Wilson Elementary School KG-6 | 387 Students | 5.5 miles away | 5 out of 5 | |
| Indianola Elementary School KG-6 | 498 Students | 5.5 miles away | Not Yet Rated | |
Compare This School To Nearby Schools ->
School Community Forum

Join a discussion about John Sutter Middle School and talk to others in the community including students, parents, teachers, and administrators.
Popular Discussion Topics
- Admissions and Registration Questions (e.g. Dress Code and Discipline Policy)
- School Calendar and Upcoming Events (e.g. Graduation)
- After School Programs, Extracurricular Activities, and Athletics (e.g. Football)
- News and Announcements (e.g. Yearbook and Class Supply List Details)
- Graduate and Alumni Events (e.g. Organizing Class Reunions)
Navigation
Can't Find What You Are Looking For?
Rankings
Nearby Cities
Sponsored Links
K-12 Articles

Public or Private?
Daniel attended private school until sixth grade, when he was diagnosed with Asperger's Syndrome, a...
Daniel attended private school until sixth grade, when he was diagnosed with Asperger's Syndrome, a...

Assisting Students to Overcome Test Anxiety
Every human copes with anxiety at one time or another. It is a basic emotion that we feel when...
Every human copes with anxiety at one time or another. It is a basic emotion that we feel when...

Parent and Family Involvement in School
When visiting my grandson's school, I often hear administrators and teachers complaining that not...
When visiting my grandson's school, I often hear administrators and teachers complaining that not...