Windmill Springs Elementary School
Rating
Not Available
Not Available

No Reviews Yet
Find Old Friends From Windmill Springs Elementary School
Use the form below to search for alumni from Windmill Springs Elementary School.
School Description
School Summary and Highlights
- Enrolls 642 elementary school students from grades KG-8
- Ranks 992nd out of 2,050 middle schools in CA.
- 2010 Overall School AYP Met Status: Yes
School Operational Details
- Title I EligibleAll students of this school are eligible for participation in authorized programs.
School District Details
- Franklin-Mckinley Elementary School District
- Per-Pupil Spending: $8,836
- Students Per Teacher: 23.1
- Enrolled Students: 10,202
Faculty Details and Student Enrollment
Students and Faculty
- Total Students Enrolled: 642
- Total Full Time "Equivalent" Teachers: 27.0
- Average Student-To-Teacher Ratio: 23.8
Students Gender Breakdown
- Males: 325 (50.6%)
- Females: 317 (49.4%)
Free Lunch Student Eligibility Breakdown
- Eligible for Reduced Lunch: 78 (12.1%)
- Eligible for Free Lunch: 315 (49.1%)
- Eligible for Either Reduced or Free Lunch: 393 (61.2%)
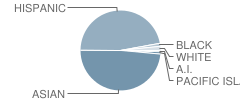
Student Enrollment Distribution by Race / Ethnicity
| Number | Percent | |
|---|---|---|
| American Indian | 5 | 0.8% |
| Black | 9 | 1.4% |
| Asian | 308 | 48.0% |
| Hispanic | 297 | 46.3% |
| White | 12 | 1.9% |
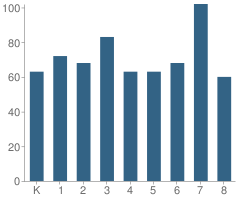
Number of Students Per Grade
| Number | Percent | |
|---|---|---|
| Kindergarten | 63 | 9.8% |
| 1st Grade | 72 | 11.2% |
| 2nd Grade | 68 | 10.6% |
| 3rd Grade | 83 | 12.9% |
| 4th Grade | 63 | 9.8% |
| 5th Grade | 63 | 9.8% |
| 6th Grade | 68 | 10.6% |
| 7th Grade | 102 | 15.9% |
| 8th Grade | 60 | 9.3% |
Teacher Education Background (2009)
Percent With Master's Degree
School:
27.3%
District:
26.7%
Percent With Bachelor's Degree
School:
9.1%
District:
8.9%
Teacher Credentials & Experience (2009)
Percent of Teachers With Credentials: 96.6%
Number of Certificated Staff: 33.0
Average Number of Years of Teacher Experience: 9.8
Average Age
School:
41.6
District:
45.3
Source: CA Department of Education, Source: NCES 2009-2010
School Ratings and Reviews
Be The First To Review Windmill Springs Elementary School!
School Map and Similar Schools Nearby
Click to Activate Map of Nearby School Campuses
Private
Public
This School
Similar Schools Nearby
| Stonegate Elementary School KG-6 | 690 Students | 0.7 miles away | Not Yet Rated | |
| O. B. Whaley Elementary School KG-6 | 692 Students | 0.7 miles away | Not Yet Rated | |
| Dove Hill Elementary School KG-6 | 681 Students | 0.9 miles away |  4 out of 5 | |
| Ramblewood Elementary School KG-6 | 399 Students | 1.0 miles away | Not Yet Rated | |
| John J. Montgomery Elementary School KG-6 | 665 Students | 1.3 miles away | Not Yet Rated | |
| Jeanne R. Meadows Elementary School KG-8 | 809 Students | 1.3 miles away | Not Yet Rated | |
| Katherine R. Smith Elementary School KG-6 | 688 Students | 1.4 miles away |  3 out of 5 | |
| Los Arboles Elementary School KG-6 | 482 Students | 1.4 miles away | Not Yet Rated | |
| Franklin Elementary School KG-6 | 808 Students | 1.5 miles away | 3 out of 5 | |
| Captain Jason M. Dahl Elementary School KG-6 | 648 Students | 1.5 miles away | Not Yet Rated | |
Compare This School To Nearby Schools ->
School Community Forum

Join a discussion about Windmill Springs Elementary School and talk to others in the community including students, parents, teachers, and administrators.
Popular Discussion Topics
- Admissions and Registration Questions (e.g. Dress Code and Discipline Policy)
- School Calendar and Upcoming Events (e.g. Graduation)
- After School Programs, Extracurricular Activities, and Athletics (e.g. Football)
- News and Announcements (e.g. Yearbook and Class Supply List Details)
- Graduate and Alumni Events (e.g. Organizing Class Reunions)
Navigation
Can't Find What You Are Looking For?
Rankings
Sponsored Links
K-12 Articles

The Cervical Cancer Vaccine
All across North America girls between the ages of 11 and 12 have the opportunity to be vaccinated...
All across North America girls between the ages of 11 and 12 have the opportunity to be vaccinated...

The Pros and Cons of Seat Belts in School Buses
Recently the news has been full of school bus accidents where children have been seriously injured...
Recently the news has been full of school bus accidents where children have been seriously injured...

Choosing a Summer Camp for Your Child
Are you planning to send your child to summer camp this year? If so, have you taken his needs into...
Are you planning to send your child to summer camp this year? If so, have you taken his needs into...