Forest Park Elementary School
Rating
Not Available
Not Available

5 out of 5 | 1 Review
Find Old Friends From Forest Park Elementary School
Use the form below to search for alumni from Forest Park Elementary School.
School Description
School Summary and Highlights
- Enrolls 893 elementary school students from grades KG-6
- Ranks 160th out of 5,423 elementary schools in CA.
- 2010 Overall School AYP Met Status: Yes
- National Blue Ribbon Schools Award 2003

Additional Contact Information
- Mailing Address: 34400 Maybird Cir., Fremont, CA 94555
School District Details
- Fremont Unified School District
- Per-Pupil Spending: $8,438
- Graduation Rate: 84.8%
- Dropout Rate: 1.5%
- Students Per Teacher: 22.3
- Enrolled Students: 32,263
Faculty Details and Student Enrollment
Students and Faculty
- Total Students Enrolled: 893
- Total Full Time "Equivalent" Teachers: 37.8
- Average Student-To-Teacher Ratio: 23.6
Students Gender Breakdown
- Males: 490 (54.9%)
- Females: 403 (45.1%)
Free Lunch Student Eligibility Breakdown
- Eligible for Reduced Lunch: 17 (1.9%)
- Eligible for Free Lunch: 36 (4.0%)
- Eligible for Either Reduced or Free Lunch: 53 (5.9%)
Student Enrollment Distribution by Race / Ethnicity

| Number | Percent | |
|---|---|---|
| American Indian | 1 | 0.1% |
| Black | 23 | 2.6% |
| Asian | 790 | 88.5% |
| Hispanic | 11 | 1.2% |
| White | 52 | 5.8% |
Number of Students Per Grade
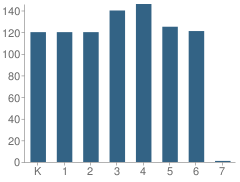
| Number | Percent | |
|---|---|---|
| Kindergarten | 120 | 13.4% |
| 1st Grade | 120 | 13.4% |
| 2nd Grade | 120 | 13.4% |
| 3rd Grade | 140 | 15.7% |
| 4th Grade | 146 | 16.3% |
| 5th Grade | 125 | 14.0% |
| 6th Grade | 121 | 13.5% |
| 7th Grade | 1 | 0.1% |
Teacher Education Background (2009)
Percent With Ph.D.
School:
2.1%
District:
8.2%
Percent With Master's Degree
School:
12.8%
District:
24.6%
Percent With Bachelor's Degree
School:
2.1%
District:
4.9%
Teacher Credentials & Experience (2009)
Percent of Teachers With Emergency Credentials: 2.2%
Percent of Teachers With Credentials: 97.8%
Number of Certificated Staff: 47.0
Average Number of Years of Teacher Experience: 10.8
Average Age
School:
40.5
District:
48.0
Source: CA Department of Education, Source: NCES 2009-2010
School Ratings and Reviews
Overall Rating: 5

5 out of 5 | 1 Review
The Overall Rating is the school's average rating from parents, students, school faculty and staff. The highest rating is five apples and the lowest is one apple.
Share Your Review About This School
1 review for Forest Park Elementary School
- Reviewed by Parent/Guardian on August 10, 2009
- Rating:
 (5 / 5) Flag as inappropriate
 - very good
School Map and Similar Schools Nearby
Click to Activate Map of Nearby School Campuses
Private
Public
This School
Similar Schools Nearby
| Ardenwood Elementary School KG-6 | 861 Students | 0.8 miles away |  5 out of 5 | |
| John F. Kennedy Elementary School KG-6 | 428 Students | 0.8 miles away | Not Yet Rated | |
| Patterson Elementary School KG-6 | 576 Students | 1.2 miles away | Not Yet Rated | |
| H. A. Snow Elementary School KG-6 | 435 Students | 1.3 miles away | Not Yet Rated | |
| Delaine Eastin Elementary School KG-5 | 882 Students | 1.3 miles away | Not Yet Rated | |
| Pioneer Elementary School KG-5 | 857 Students | 1.3 miles away | Not Yet Rated | |
| Warwick Elementary School KG-6 | 889 Students | 1.6 miles away | Not Yet Rated | |
| James A. Graham Elementary School KG-6 | 497 Students | 1.7 miles away | Not Yet Rated | |
| E. L. Musick Elementary School KG-6 | 377 Students | 1.7 miles away | Not Yet Rated | |
| Cabrillo Elementary School KG-6 | 404 Students | 1.7 miles away | Not Yet Rated | |
Compare This School To Nearby Schools ->
School Community Forum

Join a discussion about Forest Park Elementary School and talk to others in the community including students, parents, teachers, and administrators.
Popular Discussion Topics
- Admissions and Registration Questions (e.g. Dress Code and Discipline Policy)
- School Calendar and Upcoming Events (e.g. Graduation)
- After School Programs, Extracurricular Activities, and Athletics (e.g. Football)
- News and Announcements (e.g. Yearbook and Class Supply List Details)
- Graduate and Alumni Events (e.g. Organizing Class Reunions)
Navigation
Can't Find What You Are Looking For?
Rankings
Nearby Cities
Sponsored Links
K-12 Articles

Idle Hands
The worst affliction affecting our kids today is not teen pregnancy, drugs and alcohol, or...
The worst affliction affecting our kids today is not teen pregnancy, drugs and alcohol, or...

Summer Advice
A few weeks ago, at the weekly after-school program I run through my local church, a group of...
A few weeks ago, at the weekly after-school program I run through my local church, a group of...

How to Get the Best Supplies for Your Money
School supply lists can seem unending, and the price can add up very quickly. But do we really...
School supply lists can seem unending, and the price can add up very quickly. But do we really...