Joshua Chadbourne Elementary School
Rating
Not Available
Not Available

5 out of 5 | 1 Review
Find Old Friends From Joshua Chadbourne Elementary School
Use the form below to search for alumni from Joshua Chadbourne Elementary School.
School Description
School Summary and Highlights
- Enrolls 760 elementary school students from grades KG-6
- Ranks 14th out of 5,423 elementary schools in CA.
- 2010 Overall School AYP Met Status: Yes
Additional Contact Information
- Mailing Address: 801 Plymouth Ave., Fremont, CA 94539
School District Details
- Fremont Unified School District
- Per-Pupil Spending: $8,438
- Graduation Rate: 84.8%
- Dropout Rate: 1.5%
- Students Per Teacher: 22.3
- Enrolled Students: 32,263
Faculty Details and Student Enrollment
Students and Faculty
- Total Students Enrolled: 760
- Total Full Time "Equivalent" Teachers: 35.0
- Average Student-To-Teacher Ratio: 21.8
Students Gender Breakdown
- Males: 378 (49.7%)
- Females: 382 (50.3%)
Free Lunch Student Eligibility Breakdown
- Eligible for Reduced Lunch: 12 (1.6%)
- Eligible for Free Lunch: 28 (3.7%)
- Eligible for Either Reduced or Free Lunch: 40 (5.3%)
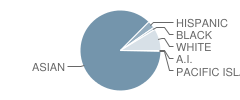
Student Enrollment Distribution by Race / Ethnicity
| Number | Percent | |
|---|---|---|
| American Indian | 2 | 0.3% |
| Black | 7 | 0.9% |
| Asian | 646 | 85.0% |
| Hispanic | 22 | 2.9% |
| White | 65 | 8.6% |
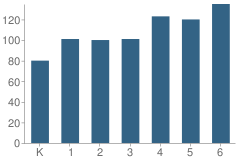
Number of Students Per Grade
| Number | Percent | |
|---|---|---|
| Kindergarten | 80 | 10.5% |
| 1st Grade | 101 | 13.3% |
| 2nd Grade | 100 | 13.2% |
| 3rd Grade | 101 | 13.3% |
| 4th Grade | 123 | 16.2% |
| 5th Grade | 120 | 15.8% |
| 6th Grade | 135 | 17.8% |
Teacher Education Background (2009)
Percent With Master's Degree
School:
14.6%
District:
24.6%
Percent With Bachelor's Degree
School:
2.4%
District:
4.9%
Teacher Credentials & Experience (2009)
Percent of Teachers With Emergency Credentials: 2.6%
Percent of Teachers With Credentials: 97.4%
Number of Certificated Staff: 41.0
Average Number of Years of Teacher Experience: 13.7
Average Age
School:
44.9
District:
48.0
Source: CA Department of Education, Source: NCES 2009-2010
School Ratings and Reviews
Overall Rating: 5

5 out of 5 | 1 Review
The Overall Rating is the school's average rating from parents, students, school faculty and staff. The highest rating is five apples and the lowest is one apple.
Share Your Review About This School
1 review for Joshua Chadbourne Elementary School
- Reviewed by Parent/Guardian on July 24, 2009
- Rating:
 (5 / 5) Flag as inappropriate
 - The school is very good
School Map and Similar Schools Nearby
Click to Activate Map of Nearby School Campuses
Private
Public
This School
Similar Schools Nearby
| Mission Valley Elementary School KG-6 | 748 Students | 0.6 miles away |  5 out of 5 | |
| John M. Gomes Elementary School KG-6 | 862 Students | 0.7 miles away | 5 out of 5 | |
| Mission San Jose Elementary School KG-6 | 644 Students | 1.4 miles away | Not Yet Rated | |
| J. Haley Durham Elementary School KG-6 | 424 Students | 1.5 miles away | Not Yet Rated | |
| O. N. Hirsch Elementary School KG-6 | 387 Students | 1.6 miles away | Not Yet Rated | |
| E. M. Grimmer Elementary School KG-6 | 413 Students | 1.6 miles away | Not Yet Rated | |
| Harvey Green Elementary School KG-6 | 423 Students | 1.9 miles away | 5 out of 5 | |
| John Blacow Elementary School KG-6 | 557 Students | 2.2 miles away | Not Yet Rated | |
| Steven Millard Elementary School KG-6 | 562 Students | 2.4 miles away |  4 out of 5 | |
| Brier Elementary School KG-6 | 624 Students | 2.5 miles away | Not Yet Rated | |
Compare This School To Nearby Schools ->
School Community Forum

Join a discussion about Joshua Chadbourne Elementary School and talk to others in the community including students, parents, teachers, and administrators.
Popular Discussion Topics
- Admissions and Registration Questions (e.g. Dress Code and Discipline Policy)
- School Calendar and Upcoming Events (e.g. Graduation)
- After School Programs, Extracurricular Activities, and Athletics (e.g. Football)
- News and Announcements (e.g. Yearbook and Class Supply List Details)
- Graduate and Alumni Events (e.g. Organizing Class Reunions)
Navigation
Can't Find What You Are Looking For?
Rankings
Nearby Cities
Sponsored Links
K-12 Articles

Assisting Students to Overcome Test Anxiety
Every human copes with anxiety at one time or another. It is a basic emotion that we feel when...
Every human copes with anxiety at one time or another. It is a basic emotion that we feel when...

Helping Your Child Leave the Nest
It's all come down to this: Eighteen years of good times and bad, and now your baby bird is ready...
It's all come down to this: Eighteen years of good times and bad, and now your baby bird is ready...

Siblings and Individual Identity in High School
When the first day of high school looms in the near future, teens are both excited and anxious....
When the first day of high school looms in the near future, teens are both excited and anxious....