Circle of Independent Learning School

No Reviews Yet
Find Old Friends From Circle of Independent Learning School
Use the form below to search for alumni from Circle of Independent Learning School.
School Description
School Summary and Highlights
- Enrolls 254 elementary, middle, and high school students from grades KG-12
- Ranks 691st out of 1,197 high schools in CA.
- 2010 Overall School AYP Met Status: Yes
Additional Contact Information
- Mailing Address: 4700 Calaveras Ave., Fremont, CA 94536
School Operational Details
- Charter School
School District Details
- Fremont Unified School District
- Per-Pupil Spending: $8,438
- Graduation Rate: 84.8%
- Dropout Rate: 1.5%
- Students Per Teacher: 22.3
- Enrolled Students: 32,263
Faculty Details and Student Enrollment
Students and Faculty
- Total Students Enrolled: 254
- Total Full Time "Equivalent" Teachers: 11.5
- Average Student-To-Teacher Ratio: 22.1
Students Gender Breakdown
- Males: 151 (59.4%)
- Females: 103 (40.6%)
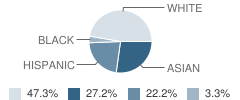
Student Enrollment Distribution by Race / Ethnicity

| Number | Percent | |
|---|---|---|
| American Indian | - | - |
| Black | 8 | 3.1% |
| Asian | 65 | 25.6% |
| Hispanic | 53 | 20.9% |
| White | 113 | 44.5% |
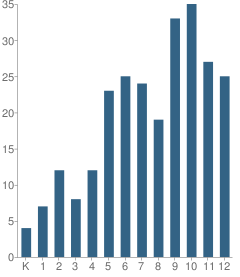
Number of Students Per Grade

| Number | Percent | |
|---|---|---|
| Kindergarten | 4 | 1.6% |
| 1st Grade | 7 | 2.8% |
| 2nd Grade | 12 | 4.7% |
| 3rd Grade | 8 | 3.1% |
| 4th Grade | 12 | 4.7% |
| 5th Grade | 23 | 9.1% |
| 6th Grade | 25 | 9.8% |
| 7th Grade | 24 | 9.4% |
| 8th Grade | 19 | 7.5% |
| 9th Grade | 33 | 13.0% |
| 10th Grade | 35 | 13.8% |
| 11th Grade | 27 | 10.6% |
| 12th Grade | 25 | 9.8% |
Teacher Education Background (2009)
Percent With Master's Degree
School:
16.7%
District:
24.6%
Teacher Credentials & Experience (2009)
Percent of Teachers With Credentials: 100.0%
Number of Certificated Staff: 12.0
Average Number of Years of Teacher Experience: 16.8
Average Age
School:
48.3
District:
48.0
Source: CA Department of Education, Source: NCES 2009-2010
School Ratings and Reviews
Be The First To Review Circle of Independent Learning School!
Sponsored Links
Test Scores and Performance Information
Overall School Rating
How is this determined?
The overall school rating shows that Circle of Independent Learning School performed on average about the same as other schools across the state on CST state exams in the following subjects:
- CST Algebra I
- CST Algebra II
- CST Biology
- CST Earth Science
- CST English-Language Arts
- CST General Mathematics
- CST Geometry
- CST History - Social Science
- CST Mathematics
- CST Science
- CST U.S. History
- CST World History
AYP Results (2010)
Overall AYP Met: Yes
ELA AYP Met: Yes
Math AYP Met: Yes
ACT Exam Results (2009)
Percent of Students Taking ACT Exam: 8.1%
SAT Exam Results (2009)
Percent of Students Taking SAT Exam: 27.0%
CST - Test Proficiency by Grade and Subject
Grade 4 - % of students at or above proficiency
| School | District | State | |
|---|---|---|---|
| CST English-Language Arts Test | |||
| 2010 | 50.0% | 82.0% | 63.0% |
| 2009 | 95.0% | 83.0% | 61.0% |
| 2008 | 79.0% | 79.0% | 55.0% |
| CST Mathematics Test | |||
| 2010 | 38.0% | 80.0% | 68.0% |
| 2009 | 89.0% | 82.0% | 66.0% |
| 2008 | 43.0% | 80.0% | 61.0% |
Grade 5 - % of students at or above proficiency
| School | District | State | |
|---|---|---|---|
| CST English-Language Arts Test | |||
| 2010 | 90.0% | 81.0% | 58.0% |
| 2009 | 77.0% | 75.0% | 54.0% |
| 2008 | 63.0% | 73.0% | 48.0% |
| CST Mathematics Test | |||
| 2010 | 74.0% | 78.0% | 61.0% |
| 2009 | 36.0% | 74.0% | 57.0% |
| 2008 | 44.0% | 73.0% | 51.0% |
| CST Science Test | |||
| 2010 | 81.0% | 78.0% | 56.0% |
| 2009 | 76.0% | 75.0% | 49.0% |
| 2008 | 75.0% | 74.0% | 46.0% |
Grade 6 - % of students at or above proficiency
| School | District | State | |
|---|---|---|---|
| CST English-Language Arts Test | |||
| 2010 | 78.0% | 80.0% | 55.0% |
| 2009 | 64.0% | 77.0% | 52.0% |
| 2008 | 81.0% | 73.0% | 47.0% |
| CST Mathematics Test | |||
| 2010 | 50.0% | 77.0% | 52.0% |
| 2009 | 43.0% | 74.0% | 49.0% |
| 2008 | 53.0% | 72.0% | 44.0% |
Grade 7 - % of students at or above proficiency
| School | District | State | |
|---|---|---|---|
| CST English-Language Arts Test | |||
| 2010 | 80.0% | 77.0% | 55.0% |
| 2009 | 53.0% | 79.0% | 54.0% |
| 2008 | 58.0% | 72.0% | 49.0% |
| CST Mathematics Test | |||
| 2010 | 42.0% | 72.0% | 48.0% |
| 2009 | 30.0% | 69.0% | 43.0% |
| 2008 | 39.0% | 66.0% | 41.0% |
Grade 8 - % of students at or above proficiency
| School | District | State | |
|---|---|---|---|
| CST English-Language Arts Test | |||
| 2010 | 70.0% | 75.0% | 54.0% |
| 2009 | 57.0% | 71.0% | 48.0% |
| 2008 | 75.0% | 66.0% | 45.0% |
| CST General Mathematics Test | |||
| 2010 | 42.0% | 18.0% | 30.0% |
| 2009 | 19.0% | 5.0% | 30.0% |
| 2008 | 39.0% | 17.0% | 31.0% |
| CST History - Social Science Test | |||
| 2010 | 53.0% | 70.0% | 47.0% |
| 2009 | 46.0% | 66.0% | 42.0% |
| 2008 | 50.0% | 60.0% | 36.0% |
| CST Science Test | |||
| 2010 | 47.0% | 75.0% | 59.0% |
| 2009 | 57.0% | 76.0% | 56.0% |
| 2008 | 59.0% | 72.0% | 52.0% |
| CST Algebra I Test | |||
| 2009 | 72.0% | 57.0% | 44.0% |
Grade 9 - % of students at or above proficiency
| School | District | State | |
|---|---|---|---|
| CST Biology Test | |||
| 2010 | 73.0% | 78.0% | 55.0% |
| CST English-Language Arts Test | |||
| 2010 | 52.0% | 75.0% | 54.0% |
| 2009 | 53.0% | 72.0% | 50.0% |
| 2008 | 32.0% | 67.0% | 49.0% |
| CST Algebra I Test | |||
| 2009 | 44.0% | 14.0% | 21.0% |
| CST General Mathematics Test | |||
| 2009 | 16.0% | 6.0% | 17.0% |
Grade 10 - % of students at or above proficiency
| School | District | State | |
|---|---|---|---|
| CST English-Language Arts Test | |||
| 2010 | 37.0% | 62.0% | 45.0% |
| 2009 | 27.0% | 63.0% | 44.0% |
| 2008 | 45.0% | 58.0% | 41.0% |
| CST Geometry Test | |||
| 2010 | 36.0% | 11.0% | 14.0% |
| CST Science Test | |||
| 2010 | 34.0% | 66.0% | 46.0% |
| 2009 | 20.0% | 65.0% | 44.0% |
| 2008 | 37.0% | 60.0% | 40.0% |
| CST World History Test | |||
| 2010 | 19.0% | 60.0% | 42.0% |
| 2009 | 32.0% | 55.0% | 38.0% |
| 2008 | 27.0% | 52.0% | 33.0% |
| CST Algebra I Test | |||
| 2009 | 23.0% | 6.0% | 11.0% |
Grade 11 - % of students at or above proficiency
| School | District | State | |
|---|---|---|---|
| CST English-Language Arts Test | |||
| 2010 | 22.0% | 58.0% | 42.0% |
| 2009 | 39.0% | 59.0% | 40.0% |
| 2008 | 23.0% | 56.0% | 37.0% |
| CST U.S. History Test | |||
| 2010 | 26.0% | 62.0% | 45.0% |
| 2009 | 33.0% | 61.0% | 44.0% |
| 2008 | 23.0% | 55.0% | 38.0% |
End of Course - % of students at or above proficiency
| School | District | State | |
|---|---|---|---|
| CST Algebra I Test | |||
| 2010 | 13.0% | 44.0% | 31.0% |
| 2009 | 40.0% | 40.0% | 28.0% |
| 2008 | 20.0% | 34.0% | 25.0% |
| CST Biology Test | |||
| 2010 | 65.0% | 66.0% | 46.0% |
| 2009 | 50.0% | 68.0% | 42.0% |
| CST Earth Science Test | |||
| 2010 | 13.0% | 10.0% | 33.0% |
| 2009 | - | - | - |
| 2008 | 15.0% | 52.0% | 28.0% |
| CST General Mathematics Test | |||
| 2010 | 29.0% | 12.0% | 27.0% |
| 2009 | 18.0% | 6.0% | 26.0% |
| 2008 | 19.0% | 8.0% | 27.0% |
| CST Geometry Test | |||
| 2010 | 47.0% | 52.0% | 27.0% |
| CST World History Test | |||
| 2010 | 23.0% | 58.0% | 41.0% |
| 2009 | 35.0% | 54.0% | 38.0% |
| 2008 | 21.0% | 50.0% | 33.0% |
| CST Algebra II Test | |||
| 2008 | 46.0% | 45.0% | 27.0% |
Grade 3 - % of students at or above proficiency
| School | District | State | |
|---|---|---|---|
| CST English-Language Arts Test | |||
| 2008 | 83.0% | 63.0% | 38.0% |
| CST Mathematics Test | |||
| 2008 | 83.0% | 79.0% | 61.0% |
Source: CA Department of Education 2009-2010
School Map and Similar Schools Nearby
Click to Activate Map of Nearby School Campuses
Private
Public
This School
Similar Schools Nearby
| Fame Public Charter School KG-12 | 1,439 Students | 1.1 miles away | ![]() 5 out of 5 | |
| Leadership Public Schools - Hayward 9-12 | 429 Students | 7.9 miles away | Not Yet Rated | - |
| Aspire East Palo Alto Phoenix Academy 9-12 | 79 Students | 9.0 miles away | Not Yet Rated | - |
| Stanford New School KG-12 | 554 Students | 10.5 miles away | Not Yet Rated | |
| Kipp King Collegiate High School 9-12 | 294 Students | 12.8 miles away | Not Yet Rated | - |
Compare This School To Nearby Schools ->
School Community Forum

Join a discussion about Circle of Independent Learning School and talk to others in the community including students, parents, teachers, and administrators.
Popular Discussion Topics
- Admissions and Registration Questions (e.g. Dress Code and Discipline Policy)
- School Calendar and Upcoming Events (e.g. Graduation)
- After School Programs, Extracurricular Activities, and Athletics (e.g. Football)
- News and Announcements (e.g. Yearbook and Class Supply List Details)
- Graduate and Alumni Events (e.g. Organizing Class Reunions)
Navigation
Can't Find What You Are Looking For?
Rankings
Nearby Cities
Sponsored Links
K-12 Articles
How to Get the Best Supplies for Your Money
School supply lists can seem unending, and the price can add up very quickly. But do we really...
The Difference Between Boys and Girls
Boys and girls are different. Give a toddler girl a G.I. Joe and she'll probably try to mother it....
Cell Phones... the Best Thing Since Sliced Bread or the Worst Invention in the World?
Cell phones are wonderful, the best things humans have ever invented! They help us keep in touch...

