Vista Alternative School
Rating
Not Available
Not Available

No Reviews Yet
Find Old Friends From Vista Alternative School
Use the form below to search for alumni from Vista Alternative School.
School Description
School Summary and Highlights
- Enrolls 76 elementary, middle, and high school students from grades KG-12
- 2010 Overall School AYP Met Status: Yes
Additional Contact Information
- Mailing Address: 4455 Seneca Park Ave., Fremont, CA 94538
School Operational Details
- Alternative School
School District Details
- Fremont Unified School District
- Per-Pupil Spending: $8,438
- Graduation Rate: 84.8%
- Dropout Rate: 1.5%
- Students Per Teacher: 22.3
- Enrolled Students: 32,263
Faculty Details and Student Enrollment
Students and Faculty
- Total Students Enrolled: 76
- Total Full Time "Equivalent" Teachers: 4.8
- Average Student-To-Teacher Ratio: 16.0
Students Gender Breakdown
- Males: 35 (46.1%)
- Females: 41 (53.9%)
Free Lunch Student Eligibility Breakdown
- Eligible for Reduced Lunch: 3 (3.9%)
- Eligible for Free Lunch: 7 (9.2%)
- Eligible for Either Reduced or Free Lunch: 10 (13.2%)
Student Enrollment Distribution by Race / Ethnicity
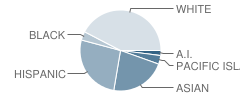
| Number | Percent | |
|---|---|---|
| American Indian | 2 | 2.6% |
| Black | 3 | 3.9% |
| Asian | 16 | 21.1% |
| Hispanic | 19 | 25.0% |
| White | 30 | 39.5% |
Number of Students Per Grade
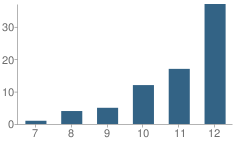
| Number | Percent | |
|---|---|---|
| 7th Grade | 1 | 1.3% |
| 8th Grade | 4 | 5.3% |
| 9th Grade | 5 | 6.6% |
| 10th Grade | 12 | 15.8% |
| 11th Grade | 17 | 22.4% |
| 12th Grade | 37 | 48.7% |
Teacher Credentials & Experience (2009)
Percent of Teachers With Credentials: 100.0%
Number of Certificated Staff: 4.0
Average Number of Years of Teacher Experience: 33.8
Average Age
School:
60.5
District:
48.0
Source: CA Department of Education, Source: NCES 2009-2010
School Ratings and Reviews
Be The First To Review Vista Alternative School!
School Map and Similar Schools Nearby
Click to Activate Map of Nearby School Campuses
Private
Public
This School
Similar Schools Nearby
| Robertson High (Continuation) School 7-12 | 263 Students | 0 miles away |  5 out of 5 | |
| Progressive Academy 9-12 | 9 Students | 4.6 miles away | Not Yet Rated | - |
| Bridgepoint High (Continuation) School 9-12 | 72 Students | 4.6 miles away | Not Yet Rated | |
| Alternative Learning Academy at Conley-Caraballo High School 9-12 | 8 Students | 7.5 miles away | Not Yet Rated | - |
| South Community School 9-12 | 31 Students | 10.0 miles away | Not Yet Rated | - |
| Village High School 9-12 | 230 Students | 10.6 miles away | Not Yet Rated | |
| Alameda County Alternative / Opportunity School 7-12 | 89 Students | 12.1 miles away | Not Yet Rated | |
| Community Day School 9-12 | 11 Students | 12.2 miles away | Not Yet Rated | - |
| Alta Vista High School 9-12 | 175 Students | 12.3 miles away | Not Yet Rated | |
| Brenkwitz High School 9-12 | 152 Students | 12.9 miles away | Not Yet Rated | |
Compare This School To Nearby Schools ->
Navigation
Can't Find What You Are Looking For?
Rankings
Nearby Cities
Sponsored Links
K-12 Articles

Helping Your Child Leave the Nest
It's all come down to this: Eighteen years of good times and bad, and now your baby bird is ready...
It's all come down to this: Eighteen years of good times and bad, and now your baby bird is ready...

Keeping Our Kids Safe in the Post 9/11 World
Recently, radio talk show host and CNN personality did a week-long special entitled "The Perfect...
Recently, radio talk show host and CNN personality did a week-long special entitled "The Perfect...

Helping Your Learning Disabled Child
Thousands of children in America struggle to learn on a daily basis. Many of them have invisible...
Thousands of children in America struggle to learn on a daily basis. Many of them have invisible...