Herbert Hoover High School

3 out of 5 | 1 Review
Find Old Friends From Herbert Hoover High School
Use the form below to search for alumni from Herbert Hoover High School.
School Description
School Summary and Highlights
- Enrolls 1,960 high school students from grades 9-12
- Ranks 1004th out of 1,197 high schools in CA.
- 2010 Overall School AYP Met Status: No
Additional Contact Information
- Mailing Address: 5550 North First St., Fresno, CA 93710
School Operational Details
- Title I EligibleAll students of this school are eligible for participation in authorized programs.
School District Details
- Fresno Unified School District
- Per-Pupil Spending: $10,053
- Graduation Rate: 58.1%
- Dropout Rate: 6.4%
- Students Per Teacher: 19.8
- Enrolled Students: 75,461
Faculty Details and Student Enrollment
Students and Faculty
- Total Students Enrolled: 1,960
- Total Full Time "Equivalent" Teachers: 95.3
- Average Student-To-Teacher Ratio: 20.6
Students Gender Breakdown
- Males: 989 (50.5%)
- Females: 971 (49.5%)
Free Lunch Student Eligibility Breakdown
- Eligible for Reduced Lunch: 229 (11.7%)
- Eligible for Free Lunch: 1,114 (56.8%)
- Eligible for Either Reduced or Free Lunch: 1,343 (68.5%)
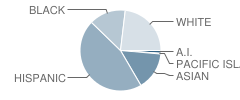
Student Enrollment Distribution by Race / Ethnicity

| Number | Percent | |
|---|---|---|
| American Indian | 24 | 1.2% |
| Black | 287 | 14.6% |
| Asian | 298 | 15.2% |
| Hispanic | 891 | 45.5% |
| White | 452 | 23.1% |
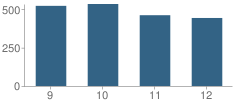
Number of Students Per Grade

| Number | Percent | |
|---|---|---|
| 9th Grade | 522 | 26.6% |
| 10th Grade | 534 | 27.2% |
| 11th Grade | 461 | 23.5% |
| 12th Grade | 443 | 22.6% |
Graduates Information (2010)
Graduation Rate
School:
78.7%
District:
74.7%
State:
78.6%
Teacher Education Background (2009)
Percent With Ph.D.
School:
92.6%
District:
1.6%
Percent With Master's Degree
School:
19.4%
District:
29.2%
Teacher Credentials & Experience (2009)
Percent of Teachers With Credentials: 96.8%
Number of Certificated Staff: 108.0
Average Number of Years of Teacher Experience: 16.9
Average Age
School:
44.3
District:
47.7
Source: CA Department of Education, Source: NCES 2009-2010
Sponsored Links
Test Scores and Performance Information
Overall School Rating
How is this determined?
The overall school rating shows that Herbert Hoover High School performed on average worse than many other schools across the state on CST state exams in the following subjects:
- CST Algebra I
- CST Algebra II
- CST Biology
- CST Chemistry
- CST Earth Science
- CST English-Language Arts
- CST General Mathematics
- CST Geometry
- CST Integrated Math 2
- CST Integrated/Coordinated Science
- CST Physics
- CST Science
- CST Summative High School Math
- CST U.S. History
- CST World History
AYP Results (2010)
Overall AYP Met: No
ELA AYP Met: No
Math AYP Met: No
Program Improvement (PI) Requirement Under NCLB (2010)
First Year PI Requirement was Implemented: 2009-2010
School's Placement Under NCLB: Year 2
ACT Exam Results (2009)
Percent of Students Taking ACT Exam: 2.8%
Average Combined Score: 19.8
Percent Scoring At or Above 21: 53.9%
SAT Exam Results (2009)
Percent of Students Taking SAT Exam: 27.6%
Average Combined Score: 1,352.1
Critical Reading Average: 451.7
Math Average: 459.3
Writing Average: 441.1
Percent Scoring At or Above 1500: 26.8%
CST - Test Proficiency by Grade and Subject
Grade 9 - % of students at or above proficiency
| School | District | State | |
|---|---|---|---|
| CST Algebra I Test | |||
| 2010 | 8.0% | 12.0% | 22.0% |
| 2009 | 10.0% | 9.0% | 21.0% |
| 2008 | 9.0% | 7.0% | 18.0% |
| CST Algebra II Test | |||
| 2010 | 50.0% | 52.0% | 69.0% |
| 2009 | 60.0% | 57.0% | 65.0% |
| 2008 | 38.0% | 46.0% | 66.0% |
| CST Biology Test | |||
| 2010 | 29.0% | 47.0% | 55.0% |
| 2009 | 35.0% | 49.0% | 51.0% |
| 2008 | 67.0% | 58.0% | 52.0% |
| CST English-Language Arts Test | |||
| 2010 | 38.0% | 40.0% | 54.0% |
| 2009 | 39.0% | 35.0% | 50.0% |
| 2008 | 38.0% | 34.0% | 49.0% |
| CST General Mathematics Test | |||
| 2010 | 5.0% | 6.0% | 17.0% |
| 2009 | 2.0% | 4.0% | 17.0% |
| CST Geometry Test | |||
| 2010 | 28.0% | 28.0% | 46.0% |
| 2009 | 20.0% | 28.0% | 47.0% |
| 2008 | 20.0% | 19.0% | 43.0% |
| CST Earth Science Test | |||
| 2009 | 10.0% | 15.0% | 29.0% |
| 2008 | 17.0% | 17.0% | 31.0% |
Grade 10 - % of students at or above proficiency
| School | District | State | |
|---|---|---|---|
| CST Algebra I Test | |||
| 2010 | 4.0% | 4.0% | 12.0% |
| 2009 | 5.0% | 2.0% | 11.0% |
| 2008 | 5.0% | 3.0% | 9.0% |
| CST Algebra II Test | |||
| 2010 | 18.0% | 22.0% | 40.0% |
| 2009 | 20.0% | 20.0% | 37.0% |
| 2008 | 25.0% | 16.0% | 36.0% |
| CST Biology Test | |||
| 2010 | 14.0% | 22.0% | 38.0% |
| 2009 | 18.0% | 19.0% | 34.0% |
| 2008 | 28.0% | 22.0% | 35.0% |
| CST Chemistry Test | |||
| 2010 | 40.0% | 36.0% | 47.0% |
| 2009 | 56.0% | 31.0% | 44.0% |
| 2008 | 39.0% | 30.0% | 41.0% |
| CST English-Language Arts Test | |||
| 2010 | 35.0% | 31.0% | 45.0% |
| 2009 | 32.0% | 28.0% | 44.0% |
| 2008 | 39.0% | 27.0% | 41.0% |
| CST Geometry Test | |||
| 2010 | 6.0% | 4.0% | 14.0% |
| 2009 | 3.0% | 3.0% | 14.0% |
| 2008 | 3.0% | 3.0% | 12.0% |
| CST Physics Test | |||
| 2010 | 5.0% | 6.0% | 44.0% |
| CST Science Test | |||
| 2010 | 34.0% | 33.0% | 46.0% |
| 2009 | 31.0% | 31.0% | 44.0% |
| 2008 | 35.0% | 27.0% | 40.0% |
| CST Summative High School Math Test | |||
| 2010 | 68.0% | 59.0% | 75.0% |
| 2009 | 45.0% | 50.0% | 71.0% |
| 2008 | 56.0% | 47.0% | 68.0% |
| CST World History Test | |||
| 2010 | 35.0% | 33.0% | 42.0% |
| 2009 | 29.0% | 28.0% | 38.0% |
| 2008 | 40.0% | 28.0% | 33.0% |
Grade 11 - % of students at or above proficiency
| School | District | State | |
|---|---|---|---|
| CST Algebra I Test | |||
| 2010 | 10.0% | 2.0% | 8.0% |
| 2009 | 4.0% | 1.0% | 8.0% |
| 2008 | 9.0% | 2.0% | 5.0% |
| CST Algebra II Test | |||
| 2010 | 9.0% | 4.0% | 14.0% |
| 2009 | 4.0% | 2.0% | 12.0% |
| 2008 | 5.0% | 3.0% | 11.0% |
| CST Biology Test | |||
| 2010 | 20.0% | 39.0% | 46.0% |
| 2009 | 49.0% | 30.0% | 41.0% |
| 2008 | 38.0% | 24.0% | 39.0% |
| CST Chemistry Test | |||
| 2010 | 18.0% | 13.0% | 30.0% |
| 2009 | 13.0% | 13.0% | 27.0% |
| 2008 | 15.0% | 12.0% | 25.0% |
| CST English-Language Arts Test | |||
| 2010 | 29.0% | 27.0% | 42.0% |
| 2009 | 35.0% | 26.0% | 40.0% |
| 2008 | 32.0% | 23.0% | 37.0% |
| CST Geometry Test | |||
| 2010 | 4.0% | 2.0% | 6.0% |
| 2009 | 2.0% | 1.0% | 7.0% |
| 2008 | 1.0% | 1.0% | 6.0% |
| CST Integrated Math 2 Test | |||
| 2010 | 15.0% | 9.0% | 19.0% |
| 2009 | 12.0% | 6.0% | 15.0% |
| 2008 | 15.0% | 7.0% | 13.0% |
| CST Physics Test | |||
| 2010 | 14.0% | 16.0% | 53.0% |
| 2009 | 35.0% | 21.0% | 50.0% |
| 2008 | 16.0% | 16.0% | 47.0% |
| CST Summative High School Math Test | |||
| 2010 | 21.0% | 24.0% | 50.0% |
| 2009 | 21.0% | 21.0% | 47.0% |
| 2008 | 20.0% | 19.0% | 43.0% |
| CST U.S. History Test | |||
| 2010 | 29.0% | 31.0% | 45.0% |
| 2009 | 43.0% | 31.0% | 44.0% |
| 2008 | 40.0% | 27.0% | 38.0% |
| CST World History Test | |||
| 2010 | 7.0% | 14.0% | 15.0% |
| 2009 | 11.0% | 7.0% | 11.0% |
| CST Integrated/Coordinated Science Test | |||
| 2009 | 5.0% | 5.0% | 11.0% |
| CST Earth Science Test | |||
| 2008 | 18.0% | 13.0% | 28.0% |
End of Course - % of students at or above proficiency
| School | District | State | |
|---|---|---|---|
| CST Algebra I Test | |||
| 2010 | 7.0% | 25.0% | 31.0% |
| 2009 | 9.0% | 21.0% | 28.0% |
| 2008 | 8.0% | 19.0% | 25.0% |
| CST Algebra II Test | |||
| 2010 | 15.0% | 14.0% | 31.0% |
| 2009 | 15.0% | 13.0% | 28.0% |
| 2008 | 19.0% | 11.0% | 27.0% |
| CST Biology Test | |||
| 2010 | 25.0% | 31.0% | 46.0% |
| 2009 | 28.0% | 27.0% | 42.0% |
| 2008 | 37.0% | 29.0% | 42.0% |
| CST Chemistry Test | |||
| 2010 | 29.0% | 21.0% | 38.0% |
| 2009 | 27.0% | 18.0% | 36.0% |
| 2008 | 24.0% | 18.0% | 32.0% |
| CST General Mathematics Test | |||
| 2010 | 5.0% | 16.0% | 27.0% |
| 2009 | 2.0% | 23.0% | 26.0% |
| CST Geometry Test | |||
| 2010 | 12.0% | 14.0% | 27.0% |
| 2009 | 9.0% | 13.0% | 26.0% |
| 2008 | 9.0% | 10.0% | 24.0% |
| CST Integrated Math 2 Test | |||
| 2010 | 15.0% | 10.0% | 27.0% |
| 2009 | 12.0% | 5.0% | 25.0% |
| 2008 | 16.0% | 7.0% | 25.0% |
| CST Physics Test | |||
| 2010 | 11.0% | 18.0% | 49.0% |
| 2009 | 30.0% | 19.0% | 46.0% |
| 2008 | 16.0% | 17.0% | 43.0% |
| CST Summative High School Math Test | |||
| 2010 | 30.0% | 28.0% | 54.0% |
| 2009 | 25.0% | 24.0% | 50.0% |
| 2008 | 25.0% | 23.0% | 47.0% |
| CST World History Test | |||
| 2010 | 34.0% | 32.0% | 41.0% |
| 2009 | 29.0% | 27.0% | 38.0% |
| 2008 | 39.0% | 25.0% | 33.0% |
| CST Earth Science Test | |||
| 2009 | 10.0% | 14.0% | 28.0% |
| 2008 | 17.0% | 16.0% | 28.0% |
| CST Integrated/Coordinated Science Test | |||
| 2009 | 6.0% | 5.0% | 13.0% |
Source: CA Department of Education 2009-2010
School Map and Similar Schools Nearby
Click to Activate Map of Nearby School Campuses
Private
Public
This School
Similar Schools Nearby
| Bullard High School 9-12 | 2,649 Students | 2.0 miles away | Not Yet Rated | |
| Erma Duncan Polytechnical High School 9-12 | 988 Students | 2.6 miles away | Not Yet Rated | |
| Mclane High School 9-12 | 2,449 Students | 3.1 miles away | Not Yet Rated | |
| Clovis West High School 9-12 | 2,442 Students | 3.1 miles away | ![]() 5 out of 5 | |
| Fresno High School 9-12 | 2,676 Students | 4.0 miles away | Not Yet Rated | |
| Buchanan High School 9-12 | 2,720 Students | 4.3 miles away | ![]() 5 out of 5 | |
| Clovis High School 9-12 | 2,669 Students | 5.0 miles away | ![]() 5 out of 5 | |
| Roosevelt High School 9-12 | 2,426 Students | 5.2 miles away | Not Yet Rated | |
| Central High East Campus School 9-12 | 3,795 Students | 6.5 miles away | Not Yet Rated | |
| Sunnyside High School 9-12 | 3,193 Students | 6.6 miles away | ![]() 4 out of 5 | |
Compare This School To Nearby Schools ->
School Community Forum

Join a discussion about Herbert Hoover High School and talk to others in the community including students, parents, teachers, and administrators.
Popular Discussion Topics
- Admissions and Registration Questions (e.g. Dress Code and Discipline Policy)
- School Calendar and Upcoming Events (e.g. Graduation)
- After School Programs, Extracurricular Activities, and Athletics (e.g. Football)
- News and Announcements (e.g. Yearbook and Class Supply List Details)
- Graduate and Alumni Events (e.g. Organizing Class Reunions)
Navigation
Can't Find What You Are Looking For?
Rankings
Nearby Cities
Sponsored Links
K-12 Articles
Democracy in Action
There is still over a year until the general election, but the election cycle has been in full...
Imho
I was watching Headline News's news ticker when I read something that made me LOL. The ticker said...
All About Backpacks
Your child riffles through his backpack to find homework assignments, his MP3 player, lunch money...


(3 / 5) 
