Wawona Middle School
Rating
Not Available
Not Available

5 out of 5 | 1 Review
Find Old Friends From Wawona Middle School
Use the form below to search for alumni from Wawona Middle School.
School Description
School Summary and Highlights
- Enrolls 974 middle school students from grades 7-8
- Ranks 1627th out of 2,050 middle schools in CA.
- 2010 Overall School AYP Met Status: No
Additional Contact Information
- Mailing Address: 4524 North Thorne Ave., Fresno, CA 93704
School Operational Details
- Title I EligibleAll students of this school are eligible for participation in authorized programs.
School District Details
- Fresno Unified School District
- Per-Pupil Spending: $10,053
- Graduation Rate: 58.1%
- Dropout Rate: 6.4%
- Students Per Teacher: 19.8
- Enrolled Students: 75,461
Faculty Details and Student Enrollment
Students and Faculty
- Total Students Enrolled: 974
- Total Full Time "Equivalent" Teachers: 43.8
- Average Student-To-Teacher Ratio: 22.2
Students Gender Breakdown
- Males: 496 (50.9%)
- Females: 478 (49.1%)
Free Lunch Student Eligibility Breakdown
- Eligible for Reduced Lunch: 103 (10.6%)
- Eligible for Free Lunch: 755 (77.5%)
- Eligible for Either Reduced or Free Lunch: 858 (88.1%)
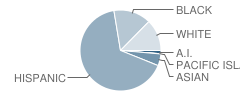
Student Enrollment Distribution by Race / Ethnicity
| Number | Percent | |
|---|---|---|
| American Indian | 13 | 1.3% |
| Black | 146 | 15.0% |
| Asian | 46 | 4.7% |
| Hispanic | 645 | 66.2% |
| White | 123 | 12.6% |
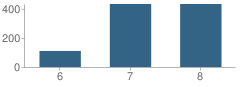
Number of Students Per Grade
| Number | Percent | |
|---|---|---|
| 6th Grade | 110 | 11.3% |
| 7th Grade | 432 | 44.4% |
| 8th Grade | 432 | 44.4% |
Teacher Education Background (2009)
Percent With Master's Degree
School:
8.5%
District:
29.2%
Teacher Credentials & Experience (2009)
Percent of Teachers With Credentials: 100.0%
Number of Certificated Staff: 47.0
Average Number of Years of Teacher Experience: 14.5
Average Age
School:
44.0
District:
47.7
Source: CA Department of Education, Source: NCES 2009-2010
School Ratings and Reviews
Overall Rating: 5

5 out of 5 | 1 Review
The Overall Rating is the school's average rating from parents, students, school faculty and staff. The highest rating is five apples and the lowest is one apple.
Share Your Review About This School
1 review for Wawona Middle School
- Reviewed by Parent or Guardian on February 25, 2011
- Rating:
 (5 / 5) Flag as inappropriate
 - i would like too see my grades please.
School Map and Similar Schools Nearby
Click to Activate Map of Nearby School Campuses
Private
Public
This School
Similar Schools Nearby
| Powers-Ginsburg Elementary School KG-6 | 508 Students | 0.3 miles away | Not Yet Rated | |
| Bullard Talent Project School KG-8 | 730 Students | 0.5 miles away | Not Yet Rated | |
| Deborah A. Williams Elementary School KG-6 | 650 Students | 0.9 miles away | Not Yet Rated | - |
| Del Mar Elementary School KG-6 | 646 Students | 1.1 miles away | Not Yet Rated | |
| Gibson Elementary School KG-6 | 445 Students | 1.1 miles away | Not Yet Rated | |
| Roeding Elementary School KG-6 | 695 Students | 1.3 miles away | Not Yet Rated | |
| Fort Miller Middle School 7-8 | 853 Students | 1.3 miles away |  5 out of 5 | |
| Wilson Elementary School KG-6 | 713 Students | 1.5 miles away | Not Yet Rated | |
| Baird Middle School 5-8 | 605 Students | 1.5 miles away | Not Yet Rated | |
| Cooper Middle School 7-8 | 489 Students | 1.6 miles away |  3 out of 5 | |
Compare This School To Nearby Schools ->
School Community Forum

Join a discussion about Wawona Middle School and talk to others in the community including students, parents, teachers, and administrators.
Popular Discussion Topics
- Admissions and Registration Questions (e.g. Dress Code and Discipline Policy)
- School Calendar and Upcoming Events (e.g. Graduation)
- After School Programs, Extracurricular Activities, and Athletics (e.g. Football)
- News and Announcements (e.g. Yearbook and Class Supply List Details)
- Graduate and Alumni Events (e.g. Organizing Class Reunions)
Navigation
Can't Find What You Are Looking For?
Rankings
Nearby Cities
Sponsored Links
K-12 Articles

Is Your Child's Teacher a Bully?
We've all heard about kids being bullied by peers. Kids taunt, tease, pull hair, shove and push...
We've all heard about kids being bullied by peers. Kids taunt, tease, pull hair, shove and push...

Transform Your Middle School Slacker into a Scholar
All children need motivation to learn. Have your child's grades decreased since he started middle...
All children need motivation to learn. Have your child's grades decreased since he started middle...

National Memories
Few events are seared into our memory, and bring the country together-not as Democrat and...
Few events are seared into our memory, and bring the country together-not as Democrat and...