Hamilton Elementary School
Rating
Not Available
Not Available

No Reviews Yet
Find Old Friends From Hamilton Elementary School
Use the form below to search for alumni from Hamilton Elementary School.
School Description
School Summary and Highlights
- Enrolls 856 elementary school students from grades KG-8
- Ranks 1608th out of 2,050 middle schools in CA.
- 2010 Overall School AYP Met Status: No
School Operational Details
- Title I EligibleAll students of this school are eligible for participation in authorized programs.
School District Details
- Fresno Unified School District
- Per-Pupil Spending: $10,053
- Graduation Rate: 58.1%
- Dropout Rate: 6.4%
- Students Per Teacher: 19.8
- Enrolled Students: 75,461
Faculty Details and Student Enrollment
Students and Faculty
- Total Students Enrolled: 856
- Total Full Time "Equivalent" Teachers: 46.0
- Average Student-To-Teacher Ratio: 18.6
Students Gender Breakdown
- Males: 399 (46.6%)
- Females: 457 (53.4%)
Free Lunch Student Eligibility Breakdown
- Eligible for Reduced Lunch: 136 (15.9%)
- Eligible for Free Lunch: 545 (63.7%)
- Eligible for Either Reduced or Free Lunch: 681 (79.6%)
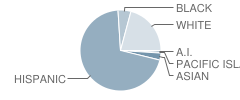
Student Enrollment Distribution by Race / Ethnicity
| Number | Percent | |
|---|---|---|
| American Indian | 7 | 0.8% |
| Black | 45 | 5.3% |
| Asian | 25 | 2.9% |
| Hispanic | 597 | 69.7% |
| White | 178 | 20.8% |
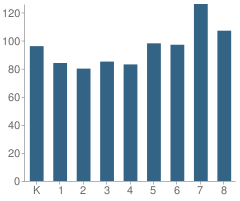
Number of Students Per Grade
| Number | Percent | |
|---|---|---|
| Kindergarten | 96 | 11.2% |
| 1st Grade | 84 | 9.8% |
| 2nd Grade | 80 | 9.3% |
| 3rd Grade | 85 | 9.9% |
| 4th Grade | 83 | 9.7% |
| 5th Grade | 98 | 11.4% |
| 6th Grade | 97 | 11.3% |
| 7th Grade | 126 | 14.7% |
| 8th Grade | 107 | 12.5% |
Teacher Education Background (2009)
Percent With Master's Degree
School:
5.9%
District:
29.2%
Teacher Credentials & Experience (2009)
Percent of Teachers With Credentials: 100.0%
Number of Certificated Staff: 51.0
Average Number of Years of Teacher Experience: 14.2
Average Age
School:
45.4
District:
47.7
Source: CA Department of Education, Source: NCES 2009-2010
School Ratings and Reviews
Be The First To Review Hamilton Elementary School!
School Map and Similar Schools Nearby
Click to Activate Map of Nearby School Campuses
Private
Public
This School
Similar Schools Nearby
| Fremont Elementary School KG-6 | 508 Students | 0.9 miles away | Not Yet Rated | |
| Heaton Elementary School KG-6 | 622 Students | 0.9 miles away | Not Yet Rated | |
| Muir Elementary School KG-6 | 535 Students | 1.2 miles away | Not Yet Rated | |
| Homan Elementary School KG-6 | 643 Students | 1.2 miles away | Not Yet Rated | |
| Deborah A. Williams Elementary School KG-6 | 650 Students | 1.3 miles away | Not Yet Rated | - |
| Roeding Elementary School KG-6 | 695 Students | 1.3 miles away | Not Yet Rated | |
| Susan B. Anthony Elementary School KG-6 | 387 Students | 1.4 miles away | Not Yet Rated | |
| Addams Elementary School KG-6 | 900 Students | 1.6 miles away | Not Yet Rated | |
| Powers-Ginsburg Elementary School KG-6 | 508 Students | 1.6 miles away | Not Yet Rated | |
| Del Mar Elementary School KG-6 | 646 Students | 1.7 miles away | Not Yet Rated | |
Compare This School To Nearby Schools ->
School Community Forum

Join a discussion about Hamilton Elementary School and talk to others in the community including students, parents, teachers, and administrators.
Popular Discussion Topics
- Admissions and Registration Questions (e.g. Dress Code and Discipline Policy)
- School Calendar and Upcoming Events (e.g. Graduation)
- After School Programs, Extracurricular Activities, and Athletics (e.g. Football)
- News and Announcements (e.g. Yearbook and Class Supply List Details)
- Graduate and Alumni Events (e.g. Organizing Class Reunions)
Navigation
Can't Find What You Are Looking For?
Rankings
Nearby Cities
Sponsored Links
K-12 Articles

Summer Safety Tips to Keep Kids Safe
It won't be long until kids run from the school, shrieking in delight because they're free for the...
It won't be long until kids run from the school, shrieking in delight because they're free for the...

The Difference Between Boys and Girls
Boys and girls are different. Give a toddler girl a G.I. Joe and she'll probably try to mother it....
Boys and girls are different. Give a toddler girl a G.I. Joe and she'll probably try to mother it....

Hurt: A Book Report
My last book report was over 15 years ago, and I'm a bit rusty, but here goes (Don't forget: book...
My last book report was over 15 years ago, and I'm a bit rusty, but here goes (Don't forget: book...