Beechwood Elementary School
Rating
Not Available
Not Available

No Reviews Yet
Find Old Friends From Beechwood Elementary School
Use the form below to search for alumni from Beechwood Elementary School.
School Description
School Summary and Highlights
- Enrolls 873 elementary school students from grades KG-8
- Ranks 8th out of 2,050 middle schools in CA.
- 2010 Overall School AYP Met Status: Yes
Additional Contact Information
- Mailing Address: 780 Beechwood Ave., Fullerton, CA 92835
School District Details
- Fullerton Elementary School District
- Per-Pupil Spending: $8,554
- Students Per Teacher: 24.1
- Enrolled Students: 13,601
Faculty Details and Student Enrollment
Students and Faculty
- Total Students Enrolled: 873
- Total Full Time "Equivalent" Teachers: 32.5
- Average Student-To-Teacher Ratio: 26.9
Students Gender Breakdown
- Males: 416 (47.7%)
- Females: 457 (52.3%)
Free Lunch Student Eligibility Breakdown
- Eligible for Reduced Lunch: 10 (1.1%)
- Eligible for Free Lunch: 26 (3.0%)
- Eligible for Either Reduced or Free Lunch: 36 (4.1%)
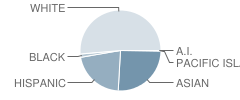
Student Enrollment Distribution by Race / Ethnicity
| Number | Percent | |
|---|---|---|
| American Indian | 1 | 0.1% |
| Black | 11 | 1.3% |
| Asian | 206 | 23.6% |
| Hispanic | 172 | 19.7% |
| White | 413 | 47.3% |
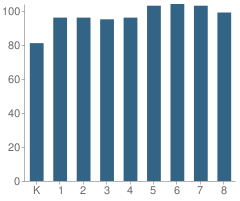
Number of Students Per Grade
| Number | Percent | |
|---|---|---|
| Kindergarten | 81 | 9.3% |
| 1st Grade | 96 | 11.0% |
| 2nd Grade | 96 | 11.0% |
| 3rd Grade | 95 | 10.9% |
| 4th Grade | 96 | 11.0% |
| 5th Grade | 103 | 11.8% |
| 6th Grade | 104 | 11.9% |
| 7th Grade | 103 | 11.8% |
| 8th Grade | 99 | 11.3% |
Teacher Education Background (2009)
Percent With Master's Degree
School:
21.1%
District:
36.1%
Percent With Bachelor's Degree: 5.3%
Teacher Credentials & Experience (2009)
Percent of Teachers With Credentials: 93.8%
Number of Certificated Staff: 38.0
Average Number of Years of Teacher Experience: 8.3
Average Age
School:
36.6
District:
50.5
Source: CA Department of Education, Source: NCES 2009-2010
School Ratings and Reviews
Be The First To Review Beechwood Elementary School!
School Map and Similar Schools Nearby
Click to Activate Map of Nearby School Campuses
Private
Public
This School
Similar Schools Nearby
| Rolling Hills Elementary School KG-6 | 603 Students | 0.7 miles away | Not Yet Rated | |
| Hermosa Drive Elementary School KG-6 | 482 Students | 0.8 miles away | Not Yet Rated | |
| Arovista Elementary School KG-6 | 576 Students | 0.9 miles away | Not Yet Rated | |
| Laguna Road Elementary School KG-6 | 618 Students | 1.1 miles away | Not Yet Rated | |
| Laurel Elementary School KG-6 | 404 Students | 1.5 miles away |  3 out of 5 | |
| Acacia Elementary School KG-6 | 555 Students | 1.7 miles away | Not Yet Rated | |
| Raymond Elementary School KG-6 | 454 Students | 1.8 miles away | Not Yet Rated | |
| Golden Hill Elementary School KG-6 | 705 Students | 2.1 miles away | Not Yet Rated | |
| Commonwealth Elementary School KG-6 | 413 Students | 2.5 miles away | Not Yet Rated | |
| Maple Elementary School KG-6 | 415 Students | 2.5 miles away | Not Yet Rated | |
Compare This School To Nearby Schools ->
School Community Forum

Join a discussion about Beechwood Elementary School and talk to others in the community including students, parents, teachers, and administrators.
Popular Discussion Topics
- Admissions and Registration Questions (e.g. Dress Code and Discipline Policy)
- School Calendar and Upcoming Events (e.g. Graduation)
- After School Programs, Extracurricular Activities, and Athletics (e.g. Football)
- News and Announcements (e.g. Yearbook and Class Supply List Details)
- Graduate and Alumni Events (e.g. Organizing Class Reunions)
Navigation
Can't Find What You Are Looking For?
Rankings
Nearby Cities
Sponsored Links
K-12 Articles

Summer Reading
In 1998, a book was published in the US that turned a hatred of reading to love. "Harry Potter and...
In 1998, a book was published in the US that turned a hatred of reading to love. "Harry Potter and...

Feeling Good in Your Own Skin
Body image is a very touchy issue with today's kids. Since the 1950s, when Barbie was first...
Body image is a very touchy issue with today's kids. Since the 1950s, when Barbie was first...

Teaching Kids to Deal with Peer Pressure
Parents usually become very concerned when they hear the term "peer pressure." However, peer...
Parents usually become very concerned when they hear the term "peer pressure." However, peer...