Gabriel Tafolla Charter School
Rating
Not Available
Not Available

5 out of 5 | 1 Review
Find Old Friends From Gabriel Tafolla Charter School
Use the form below to search for alumni from Gabriel Tafolla Charter School.
School Description
School Summary and Highlights
- Enrolls 40 middle and high school students from grades 7-12
- 2010 Overall School AYP Met Status: Yes
Additional Contact Information
- Mailing Address: P O Box 1709, Uvalde, TX 78802
- Principal or Admin: Jorge Botello
- Fax: (830) 591-1465
School Operational Details
- Alternative School
- Title I EligibleAll students of this school are eligible for participation in authorized programs.
- Charter School
School District Details
- Gabriel Tafolla Charter School District
- Per-Pupil Spending: $10,780
- Graduation Rate: 30.0%
- Dropout Rate: 10.5%
- Students Per Teacher: 10.0
- Enrolled Students: 108
Faculty Details and Student Enrollment
Students and Faculty
- Total Students Enrolled: 40
- Total Full Time "Equivalent" Teachers: 5.2
- Average Student-To-Teacher Ratio: 7.7
Students Gender Breakdown
- Males: 19 (47.5%)
- Females: 21 (52.5%)
Free Lunch Student Eligibility Breakdown
- Eligible for Reduced Lunch: 5 (12.5%)
- Eligible for Free Lunch: 32 (80.0%)
- Eligible for Either Reduced or Free Lunch: 37 (92.5%)
Student Enrollment Distribution by Race / Ethnicity
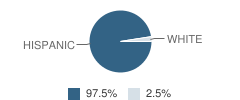
| Number | Percent | |
|---|---|---|
| American Indian | - | - |
| Black | - | - |
| Asian | - | - |
| Hispanic | 39 | 97.5% |
| White | 1 | 2.5% |
Number of Students Per Grade
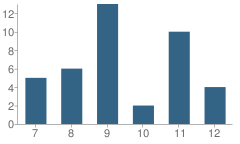
| Number | Percent | |
|---|---|---|
| 7th Grade | 5 | 12.5% |
| 8th Grade | 6 | 15.0% |
| 9th Grade | 13 | 32.5% |
| 10th Grade | 2 | 5.0% |
| 11th Grade | 10 | 25.0% |
| 12th Grade | 4 | 10.0% |
Graduation & Dropout Rates (2009)
Graduation Rate
School:
55.6%
District:
55.6%
State:
80.6%
Dropout Rate
School:
11.1%
District:
11.1%
State:
9.4%
Faculty Breakdown (2010)
Average Teacher Experience
School:
2.5
District:
2.4
State:
11.3
Percent of Teachers With 1-5 Years Experience
School:
61.4%
District:
63.1%
State:
31.0%
Percent of Teachers With 6-10 Years Experience
School:
19.3%
District:
18.5%
State:
20.3%
Faculty Salary (2010)
School Administration Average Base Salary
School:
$60,000
District:
$60,000
State:
$70,209
Teacher Average Base Salary
School:
$32,253
District:
$31,886
State:
$48,263
Beginning Teacher Average Base Salary
School:
$31,000
District:
$31,000
State:
$41,165
Teacher With 1-5 Years Experience Average Base Salary
School:
$31,941
State:
$43,527
Teacher With 6-10 Years Experience Average Base Salary
School:
$34,500
State:
$46,149
Source: TX Department of Education, Source: NCES 2009-2010
School Ratings and Reviews
Overall Rating: 5

5 out of 5 | 1 Review
The Overall Rating is the school's average rating from parents, students, school faculty and staff. The highest rating is five apples and the lowest is one apple.
Share Your Review About This School
1 review for Gabriel Tafolla Charter School
- Reviewed by Former Student on September 23, 2008
- Rating:
 (5 / 5) Flag as inappropriate
 - Hey this is an old student that use to go there just that I left the state. I just wanted to say hello to all the teachers they are doing a very good job KEEP IT UP. So charter could keep on growing. I went to Charter the first year that it open and I had a lot of fun learning there I hope that some one could remeber me some day.
Navigation
Can't Find What You Are Looking For?
Nearby Cities
Sponsored Links
K-12 Articles

Teaching Kids to Deal with Peer Pressure
Parents usually become very concerned when they hear the term “peer pressure.” However, peer...
Parents usually become very concerned when they hear the term “peer pressure.” However, peer...

Teaching Children a Love of History
Parents and grandparents are responsible for teaching children a love of history. To begin, relate...
Parents and grandparents are responsible for teaching children a love of history. To begin, relate...

Preparing Your Child for the First Day of School
It seems like school was just dismissed for the summer, yet here we are facing another year of back...
It seems like school was just dismissed for the summer, yet here we are facing another year of back...