School of Liberal Arts and Science
Rating
Not Available
Not Available

No Reviews Yet
Find Old Friends From School of Liberal Arts and Science
Use the form below to search for alumni from School of Liberal Arts and Science.
School Description
School Summary and Highlights
- Enrolls 714 school students from grades PK-10
- Ranks 695th out of 1,325 high schools in TX.
- 2010 Overall School AYP Met Status: Yes
- National Blue Ribbon Schools Award 2008

Additional Contact Information
- Mailing Address: PO Box 5129, Dallas, TX 75208
- Principal or Admin: Linda Gromowsky
- Fax: (214) 941-4866
School Operational Details
- Title I EligibleAll students of this school are eligible for participation in authorized programs.
- Charter School
School District Details
- School of Liberal Arts and Science District
- Per-Pupil Spending: $7,639
- Students Per Teacher: 13.1
- Enrolled Students: 714
Faculty Details and Student Enrollment
Students and Faculty
- Total Students Enrolled: 714
- Total Full Time "Equivalent" Teachers: 54.6
- Average Student-To-Teacher Ratio: 13.1
Students Gender Breakdown
- Males: 342 (47.9%)
- Females: 372 (52.1%)
Free Lunch Student Eligibility Breakdown
- Eligible for Reduced Lunch: 73 (10.2%)
- Eligible for Free Lunch: 591 (82.8%)
- Eligible for Either Reduced or Free Lunch: 664 (93.0%)
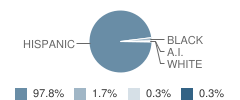
Student Enrollment Distribution by Race / Ethnicity
| Number | Percent | |
|---|---|---|
| American Indian | 2 | 0.3% |
| Black | 12 | 1.7% |
| Asian | - | - |
| Hispanic | 698 | 97.8% |
| White | 2 | 0.3% |
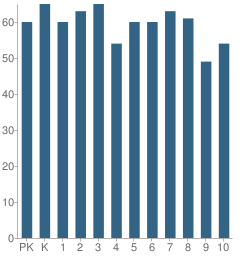
Number of Students Per Grade
| Number | Percent | |
|---|---|---|
| Pre-Kindergarten | 60 | 8.4% |
| Kindergarten | 65 | 9.1% |
| 1st Grade | 60 | 8.4% |
| 2nd Grade | 63 | 8.8% |
| 3rd Grade | 65 | 9.1% |
| 4th Grade | 54 | 7.6% |
| 5th Grade | 60 | 8.4% |
| 6th Grade | 60 | 8.4% |
| 7th Grade | 63 | 8.8% |
| 8th Grade | 61 | 8.5% |
| 9th Grade | 49 | 6.9% |
| 10th Grade | 54 | 7.6% |
Faculty Breakdown (2010)
Average Teacher Experience
School:
3.0
District:
3.0
State:
11.3
Percent of Teachers With 1-5 Years Experience
School:
76.2%
District:
76.2%
State:
31.0%
Percent of Teachers With 11-20 Years Experience
School:
3.7%
District:
3.7%
State:
24.4%
Percent of Teachers With Greater Than 20 Years Experience
School:
1.8%
District:
1.8%
State:
18.3%
Faculty Salary (2010)
School Administration Average Base Salary
School:
$55,250
District:
$55,250
State:
$70,209
Teacher Average Base Salary
School:
$41,303
District:
$41,303
State:
$48,263
Beginning Teacher Average Base Salary
School:
$39,984
District:
$39,984
State:
$41,165
Teacher With 1-5 Years Experience Average Base Salary
School:
$40,959
State:
$43,527
Teacher With 11-20 Years Experience Average Base Salary
School:
$50,450
State:
$50,153
Teacher With Greater Than 20 Years Experience Average Base Salary
School:
$50,500
State:
$58,427
Source: TX Department of Education, Source: NCES 2009-2010
School Ratings and Reviews
Be The First To Review School of Liberal Arts and Science!
School Map and Similar Schools Nearby
Click to Activate Map of Nearby School Campuses
Private
Public
This School
Similar Schools Nearby
| Life School Oak Cliff KG-12 | 1,273 Students | 3.9 miles away | Not Yet Rated | |
| Eagle Advantage Charter Elementary School KG-12 | 1,507 Students | 5.1 miles away |  1 out of 5 | |
| High School Campus 9-12 | 205 Students | 5.2 miles away | Not Yet Rated | |
| Gateway Charter Academy - Middle - High 5-12 | 344 Students | 5.3 miles away | Not Yet Rated | |
| Williams Preparatory School 9-11 | 151 Students | 6.4 miles away | Not Yet Rated | |
| Hampton Preparatory School 9-11 | 132 Students | 7.5 miles away | Not Yet Rated | |
Compare This School To Nearby Schools ->
School Community Forum

Join a discussion about School of Liberal Arts and Science and talk to others in the community including students, parents, teachers, and administrators.
Popular Discussion Topics
- Admissions and Registration Questions (e.g. Dress Code and Discipline Policy)
- School Calendar and Upcoming Events (e.g. Graduation)
- After School Programs, Extracurricular Activities, and Athletics (e.g. Football)
- News and Announcements (e.g. Yearbook and Class Supply List Details)
- Graduate and Alumni Events (e.g. Organizing Class Reunions)
Navigation
Can't Find What You Are Looking For?
Nearby Cities
Sponsored Links
K-12 Articles

Transform Your Middle School Slacker into a Scholar
All children need motivation to learn. Have your child’s grades decreased since he started middle...
All children need motivation to learn. Have your child’s grades decreased since he started middle...

Beating the Summer Slump
“The Summer Slump”, teachers call it. It happens every year. It makes its way into lesson plans...
“The Summer Slump”, teachers call it. It happens every year. It makes its way into lesson plans...

Keep Your Licensed Teen Safe This Summer
Every year hundreds of teenage drivers lose their lives in motor vehicle accidents. Statistics show...
Every year hundreds of teenage drivers lose their lives in motor vehicle accidents. Statistics show...