Jamie's House Charter School
Rating
Not Available
Not Available

3.5 out of 5 | 16 Reviews
Find Old Friends From Jamie's House Charter School
Use the form below to search for alumni from Jamie's House Charter School.
School Description
School Summary and Highlights
- Enrolls 96 elementary, middle, and high school students from grades 5-12
- 2010 Overall School AYP Met Status: No
Additional Contact Information
- Mailing Address: P O Box 681183, Houston, TX 77268
- Principal or Admin: Ms Jewel Teagle
- Fax: (281) 880-9919
School Operational Details
- Alternative School
- Title I EligibleAll students of this school are eligible for participation in authorized programs.
- Charter School
School District Details
- Jamie's House Charter School District
- Per-Pupil Spending: $17,940
- Graduation Rate: 13.3%
- Dropout Rate: 54.8%
- Students Per Teacher: 13.3
- Enrolled Students: 96
Faculty Details and Student Enrollment
Students and Faculty
- Total Students Enrolled: 96
- Total Full Time "Equivalent" Teachers: 7.2
- Average Student-To-Teacher Ratio: 13.3
Students Gender Breakdown
- Males: 47 (49.0%)
- Females: 49 (51.0%)
Free Lunch Student Eligibility Breakdown
- Eligible for Reduced Lunch: - (-)
- Eligible for Free Lunch: 90 (93.8%)
- Eligible for Either Reduced or Free Lunch: 90 (93.8%)
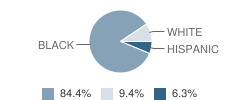
Student Enrollment Distribution by Race / Ethnicity
| Number | Percent | |
|---|---|---|
| American Indian | - | - |
| Black | 81 | 84.4% |
| Asian | - | - |
| Hispanic | 6 | 6.3% |
| White | 9 | 9.4% |
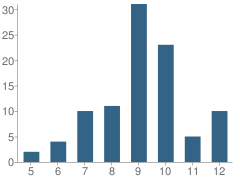
Number of Students Per Grade
| Number | Percent | |
|---|---|---|
| 5th Grade | 2 | 2.1% |
| 6th Grade | 4 | 4.2% |
| 7th Grade | 10 | 10.4% |
| 8th Grade | 11 | 11.5% |
| 9th Grade | 31 | 32.3% |
| 10th Grade | 23 | 24.0% |
| 11th Grade | 5 | 5.2% |
| 12th Grade | 10 | 10.4% |
Graduation & Dropout Rates (2009)
Graduation Rate
School:
15.6%
District:
15.6%
State:
80.6%
Dropout Rate
School:
62.5%
District:
62.5%
State:
9.4%
Faculty Breakdown (2010)
Average Teacher Experience
School:
5.1
District:
5.1
State:
11.3
Percent of Teachers With 1-5 Years Experience
School:
47.8%
District:
47.8%
State:
31.0%
Percent of Teachers With 6-10 Years Experience
School:
38.9%
District:
38.9%
State:
20.3%
Faculty Salary (2010)
School Administration Average Base Salary
School:
$35,000
District:
$35,000
State:
$70,209
Teacher Average Base Salary
School:
$29,135
District:
$29,135
State:
$48,263
Beginning Teacher Average Base Salary
School:
$28,043
District:
$28,043
State:
$41,165
Teacher With 1-5 Years Experience Average Base Salary
School:
$25,557
State:
$43,527
Teacher With 6-10 Years Experience Average Base Salary
School:
$33,907
State:
$46,149
Source: TX Department of Education, Source: NCES 2009-2010
School Ratings and Reviews
Overall Rating: 3.5

3.5 out of 5 | 16 Reviews
The Overall Rating is the school's average rating from parents, students, school faculty and staff. The highest rating is five apples and the lowest is one apple.
Share Your Review About This School
16 reviews for Jamie's House Charter School
- Reviewed by Parent/Guardian on May 19, 2010
- Rating:
 (5 / 5) Flag as inappropriate
 - I TOTALLY support the actions of the teacher. Often times we send our kids to school and they are picked on and harassed by other kids with no one to take up for them. What sent her over the edge was him picking on a handicap little girl. TRUE she may have went too far, but she was taking up for another defenseless kid! And all the licks were open handed. Maybe if his mom was doing a little of this at home he wouldn't be such a bully at school. I wish we had more teachers like her who stopped the bullying. I'm sure the kids in that class will think twice before picking on someone else.
- Reviewed by Parent/Guardian on May 15, 2010
- Rating: (5 / 5) Flag as inappropriate
- First of all, I give honer to god. I feel no one should be blamed but the teacher involved and the witnessing teacher for the beating of that child. The (...) should be embarrassed about the incident and other incidents that have been going on there. she's supposed to be in charge, not the teachers or the students doing what they want. the teacher couldn't have been the teacher of the year for two years in a row for nothing. She was only worried about a child with a disability who was being picked on. (no respect or home training; his mother says "she doesn't discipline her child", couldn't that have been the problem?) That this child has been expelled several times, and the problems still occur with that particular child. That still does not give her the right to beat him. she should have reported it, put him out of her class and written him up for harassment of another student. Then told the disabled child's parent so that she can sue him for harassment of her child. then the parent would have removed him from that school. He was nothing but a trouble maker. It is a good teaching curriculum at charter schools, so that's why the parent keeps sending him back. And no my children don't go there and I don't know anyone that does. I'm just giving my opinion to the situation. I feel after this "yes" the school will remain open, they will clean it up and get new staff for next year.
- Reviewed by Community Member on May 14, 2010
- Rating: (5 / 5) Flag as inappropriate
- This is a great place to study if you want to grow up to be a prison guard at Guantanamo. The wonderful teaching staff will teach you all of the moves you need to beat the heck out of detainees. Let me warn you, this school is not for everyone. You need a thick head and a thick hide to make it here.
- Reviewed by Parent/Guardian on May 14, 2010
- Rating: (5 / 5) Flag as inappropriate
- Considering the thing that has been in the news about this school and its staff, why would anyone in the right frame of mind send their child to this school? and as for the staff, YOU ALL SHOULD BE ASHAMED OF YOURSELVES, INCLUDING THE PRINCIPAL, DIRECTOR, OR WHOMEVER IS IN CHARGE OF THIS BUILDING; ALL OF THOSE STAFF MEMBERS THAT WITNESSED THIS SHOULD BE PUT IN JAIL AND THE GUARDS SHOULD BE LET LOOSE ON THAT (...). I AM OUTRAGED ABOUT THIS, THAT SCHOOL NEEDS TO BE CLOSED DOWN.
- Reviewed by Parent/Guardian on May 13, 2010
- Rating:
 (1 / 5) Flag as inappropriate
 - Heavy discipline, beatings daily.
- Reviewed by Community Member on May 13, 2010
- Rating: (5 / 5) Flag as inappropriate
- That kid was making fun of a special ed kid in the class. I'm sorry she lost her job, after all, they did sadly have to fire her. However, I'm glad that someone had the respect enough for the children around who are punks to jump in and SCREAM NO MORE. DO YOU UNDERSTAND NO MORE! WE HAVE HAD ENOUGH! These kids placed in alternative schools, that can't make it in regular schools, use a lot of funding because of their behavior. They need to be stopped, and personally I think the paddle needs to be brought back. What does one do when they can not control a kid in the class. Some of these total monsters need to be slapped, hit, and kicked like a dog when they are treating others in that fashion. The uprising of these punks have to stop! Much of it has to do with the parents, but not all. I'm a firm believer of genetic issues, about how one child needs more attention to be gratified than others. The problem is that, bystanders are subject to the whims of these kids, and nothing else works. My guess is that this kid may think twice now about being verbally abusive to his next teachers, and other classmates down the road. Sorry someone had to get fired, and all the rest that will happen. at least the teacher was someone that finally stood up to a juvenile jerk
- Reviewed by Parent/Guardian on May 13, 2010
- Rating: (1 / 5) Flag as inappropriate
- WOW!! The fact that the mother had to be told by her son means all of the teachers have been covering for each other and this has probably happened before. The Principal and the teacher should be fired, sued and thrown in jail.
- Reviewed by Parent/Guardian on May 13, 2010
- Rating: (1 / 5) Flag as inappropriate
- Yes I particularly like the part where they beat the stuffing out of your kids. Very cool!
- Reviewed by Parent/Guardian on May 13, 2010
- Rating: (5 / 5) Flag as inappropriate
- I just watched the video. I can't believe that teacher! It makes you wonder how long this has been going on. And the school needs to be shut down. Think about it. If those teachers sat there and watched this poor kid get beat then there is no one there fit to teach the kids! That teacher is lucky that wasn't my child!
- Reviewed by Parent/Guardian on May 11, 2010
- Rating: (5 / 5) Flag as inappropriate
- I WOULDN'T WALK BY THIS SCHOOL. NEVER MIND PUT MY CHILDREN IN IT. THIS SCHOOL SHOULD BE CLOSED.
- Reviewed by Parent/Guardian on May 11, 2010
- Rating: (1 / 5) Flag as inappropriate
- This school should be shut down. It is nothing but an eyesore. Kids are always seen walking down the middle of the road during the day. The place is a dump. I do not see how it is even up and running.
- Reviewed by Parent/Guardian on April 13, 2010
- Rating: (1 / 5) Flag as inappropriate
- Appears to be constant turmoil.Fights are a regular weekly element, really offensive language form both kids and staff.I do not think school rates well with TEA and have to query if they learn as per Tea recomendations.would not recommend school.
- Reviewed by Student on December 14, 2009
- Rating:
 (4 / 5) Flag as inappropriate
 - it's alright
- Reviewed by Community Member on April 14, 2009
- Rating: (5 / 5) Flag as inappropriate
- GREAT SCHOOL! Kids will be kids, they control them just as any other school unless you are wealthy enough to afford a private school I think they do the best with what we are given and you can finish that sentence if you want!
- Reviewed by Student on October 10, 2008
- Rating: (1 / 5) Flag as inappropriate
- this is the worst school to register at because their is nothing but fights all day every and 24/7
- Reviewed by Student on August 31, 2007
- Rating: (5 / 5) Flag as inappropriate
- Jamie's House is the best school ever! I believe everyone is good at hating on this school because the principals treat us like our age instead of little children that don't know how to control their selves.So I think it would be a great decision to register at Jamie's House.
Read All 16 Reviews ->
School Map and Similar Schools Nearby
Click to Activate Map of Nearby School Campuses
Private
Public
This School
Similar Schools Nearby
| Richard Milburn Academy - Suburban 9-12 | 275 Students | 3.4 miles away |  5 out of 5 | |
| Comquest Academy 9-12 | 75 Students | 11.0 miles away | 5 out of 5 | |
Compare This School To Nearby Schools ->
Navigation
Can't Find What You Are Looking For?
Sponsored Links
K-12 Articles

School Violence: Can It Be Stopped
It’s a fact that violence in schools is prevalent in today’s society. We hear of school shootings,...
It’s a fact that violence in schools is prevalent in today’s society. We hear of school shootings,...

Parent-Teacher Conference Dos and Don'ts
Finals are over and done, and grades have arrived. Now comes the dreaded time to discuss the...
Finals are over and done, and grades have arrived. Now comes the dreaded time to discuss the...

Cut the Credit and Save You Some Money
Today’s society glorifies a get-it-now mentality. Children learn this early. You probably noticed...
Today’s society glorifies a get-it-now mentality. Children learn this early. You probably noticed...