Abbott School
Rating
Not Available
Not Available

No Reviews Yet
Find Old Friends From Abbott School
Use the form below to search for alumni from Abbott School.
School Description
School Summary and Highlights
- Enrolls 297 school students from grades PK-12
- Ranks 27th out of 1,325 high schools in TX.
- 2010 Overall School AYP Met Status: Yes
Additional Contact Information
- Mailing Address: P O Box 226, Abbott, TX 76621
- Principal or Admin: Mr D J Beseda
- Fax: (254) 582-5430
- Website: www.abbottisd.org
School Operational Details
- Title I EligibleAll students of this school are eligible for participation in authorized programs.
School District Details
- Abbott Independent School District (ISD)
- Per-Pupil Spending: $8,533
- Graduation Rate: 85.0%
- Students Per Teacher: 10.5
- Enrolled Students: 297
Faculty Details and Student Enrollment
Students and Faculty
- Total Students Enrolled: 297
- Total Full Time "Equivalent" Teachers: 28.3
- Average Student-To-Teacher Ratio: 10.5
Students Gender Breakdown
- Males: 162 (54.5%)
- Females: 135 (45.5%)
Free Lunch Student Eligibility Breakdown
- Eligible for Reduced Lunch: 71 (23.9%)
- Eligible for Free Lunch: 54 (18.2%)
- Eligible for Either Reduced or Free Lunch: 125 (42.1%)
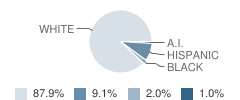
Student Enrollment Distribution by Race / Ethnicity
| Number | Percent | |
|---|---|---|
| American Indian | 3 | 1.0% |
| Black | 6 | 2.0% |
| Asian | - | - |
| Hispanic | 27 | 9.1% |
| White | 261 | 87.9% |
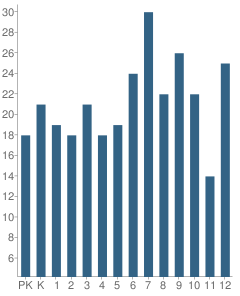
Number of Students Per Grade
| Number | Percent | |
|---|---|---|
| Pre-Kindergarten | 18 | 6.1% |
| Kindergarten | 21 | 7.1% |
| 1st Grade | 19 | 6.4% |
| 2nd Grade | 18 | 6.1% |
| 3rd Grade | 21 | 7.1% |
| 4th Grade | 18 | 6.1% |
| 5th Grade | 19 | 6.4% |
| 6th Grade | 24 | 8.1% |
| 7th Grade | 30 | 10.1% |
| 8th Grade | 22 | 7.4% |
| 9th Grade | 26 | 8.8% |
| 10th Grade | 22 | 7.4% |
| 11th Grade | 14 | 4.7% |
| 12th Grade | 25 | 8.4% |
Breakdown of College Ready Graduates (2009)
Percent Ready For College in Reading
School:
67.0%
District:
67.0%
State:
62.0%
Percent Ready For College in Math
School:
88.0%
State:
60.0%
Graduation & Dropout Rates (2009)
Graduation Rate
School:
100.0%
District:
100.0%
State:
80.6%
Faculty Breakdown (2010)
Average Teacher Experience
School:
15.2
District:
15.2
State:
11.3
Percent of Teachers With 1-5 Years Experience
School:
28.3%
District:
28.3%
State:
31.0%
Percent of Teachers With 6-10 Years Experience
School:
7.1%
District:
7.1%
State:
20.3%
Percent of Teachers With 11-20 Years Experience
School:
35.8%
District:
35.8%
State:
24.4%
Percent of Teachers With Greater Than 20 Years Experience
School:
28.8%
District:
28.8%
State:
18.3%
Faculty Salary (2010)
School Administration Average Base Salary
School:
$62,000
District:
$62,000
State:
$70,209
Teacher Average Base Salary
School:
$43,151
District:
$43,151
State:
$48,263
Teacher With 1-5 Years Experience Average Base Salary
School:
$32,781
State:
$43,527
Teacher With 6-10 Years Experience Average Base Salary
School:
$36,855
State:
$46,149
Teacher With 11-20 Years Experience Average Base Salary
School:
$42,549
State:
$50,153
Teacher With Greater Than 20 Years Experience Average Base Salary
School:
$55,627
State:
$58,427
Source: TX Department of Education, Source: NCES 2009-2010
School Ratings and Reviews
Be The First To Review Abbott School!
School Map and Similar Schools Nearby
Click to Activate Map of Nearby School Campuses
Private
Public
This School
Similar Schools Nearby
| West High School 9-12 | 468 Students | 4.0 miles away |  5 out of 5 | |
| Bynum School PK-12 | 233 Students | 7.4 miles away | Not Yet Rated | |
| Hillsboro High School 9-12 | 450 Students | 8.2 miles away | Not Yet Rated | |
| Penelope School PK-12 | 196 Students | 8.6 miles away | Not Yet Rated | |
| Aquilla School PK-12 | 237 Students | 8.6 miles away | Not Yet Rated | |
| Hillsboro Junior High School 7-8 | 237 Students | 9.3 miles away | Not Yet Rated | |
| Whitney High School 9-12 | 435 Students | 15.4 miles away | Not Yet Rated | |
| Hubbard High School 9-12 | 127 Students | 15.7 miles away |  3 out of 5 | |
| Connally Junior High School 7-8 | 319 Students | 15.9 miles away | Not Yet Rated | |
| Axtell High School 9-12 | 207 Students | 16.6 miles away | Not Yet Rated | |
Compare This School To Nearby Schools ->
School Community Forum

Join a discussion about Abbott School and talk to others in the community including students, parents, teachers, and administrators.
Popular Discussion Topics
- Admissions and Registration Questions (e.g. Dress Code and Discipline Policy)
- School Calendar and Upcoming Events (e.g. Graduation)
- After School Programs, Extracurricular Activities, and Athletics (e.g. Football)
- News and Announcements (e.g. Yearbook and Class Supply List Details)
- Graduate and Alumni Events (e.g. Organizing Class Reunions)
Navigation
Can't Find What You Are Looking For?
Nearby Cities
Sponsored Links
K-12 Articles

The Very Best Things in the World
A recent poll in the U.K. revealed that children view the "very best thing in the world" as being...
A recent poll in the U.K. revealed that children view the "very best thing in the world" as being...

Changing Schools Isn't Easy: Tips for a Successful Transition
It isn't easy for students to make the transition into a new school, especially if they have...
It isn't easy for students to make the transition into a new school, especially if they have...

Helping Your Child Leave the Nest
It's all come down to this: Eighteen years of good times and bad, and now your baby bird is ready...
It's all come down to this: Eighteen years of good times and bad, and now your baby bird is ready...