La Quinta High School
Rating
Not Available
Not Available

No Reviews Yet
Find Old Friends From La Quinta High School
Use the form below to search for alumni from La Quinta High School.
School Description
School Summary and Highlights
- Enrolls 2,038 high school students from grades 9-12
- Ranks 60th out of 1,197 high schools in CA.
- 2010 Overall School AYP Met Status: Yes
Additional Contact Information
- Mailing Address: 10372 Mcfadden St., Westminster, CA 92683
School Operational Details
- Title I EligibleAll students of this school are eligible for participation in authorized programs.
School District Details
- Garden Grove Unified School District
- Per-Pupil Spending: $9,383
- Graduation Rate: 51.1%
- Dropout Rate: 1.6%
- Students Per Teacher: 24.4
- Enrolled Students: 47,878
Faculty Details and Student Enrollment
Students and Faculty
- Total Students Enrolled: 2,038
- Total Full Time "Equivalent" Teachers: 72.6
- Average Student-To-Teacher Ratio: 28.1
Students Gender Breakdown
- Males: 1,033 (50.7%)
- Females: 1,005 (49.3%)
Free Lunch Student Eligibility Breakdown
- Eligible for Reduced Lunch: 283 (13.9%)
- Eligible for Free Lunch: 1,077 (52.8%)
- Eligible for Either Reduced or Free Lunch: 1,360 (66.7%)
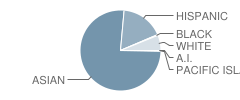
Student Enrollment Distribution by Race / Ethnicity
| Number | Percent | |
|---|---|---|
| American Indian | 2 | 0.10% |
| Black | 7 | 0.3% |
| Asian | 1,548 | 76.0% |
| Hispanic | 349 | 17.1% |
| White | 125 | 6.1% |
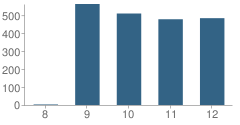
Number of Students Per Grade
| Number | Percent | |
|---|---|---|
| 8th Grade | 3 | 0.1% |
| 9th Grade | 563 | 27.6% |
| 10th Grade | 510 | 25.0% |
| 11th Grade | 478 | 23.5% |
| 12th Grade | 484 | 23.7% |
Graduates Information (2010)
Graduation Rate
School:
95.1%
District:
91.3%
State:
78.6%
Teacher Education Background (2009)
Percent With Master's Degree
School:
4.8%
District:
2.9%
Percent With Bachelor's Degree
School:
8.4%
District:
2.9%
Teacher Credentials & Experience (2009)
Percent of Teachers With Emergency Credentials: 1.4%
Percent of Teachers With Credentials: 95.9%
Number of Certificated Staff: 83.0
Average Number of Years of Teacher Experience: 13.7
Average Age
School:
41.0
District:
43.2
Source: CA Department of Education, Source: NCES 2009-2010
School Ratings and Reviews
Be The First To Review La Quinta High School!
School Map and Similar Schools Nearby
Click to Activate Map of Nearby School Campuses
Private
Public
This School
Similar Schools Nearby
| Los Amigos High School 9-12 | 2,253 Students | 1.6 miles away | Not Yet Rated | |
| Bolsa Grande High School 9-12 | 1,918 Students | 1.9 miles away | Not Yet Rated | |
| Fountain Valley High School 9-12 | 3,282 Students | 2.4 miles away | Not Yet Rated | |
| Hector G. Godinez School 9-12 | 2,172 Students | 2.5 miles away | Not Yet Rated | - |
| Santiago High School 9-12 | 2,270 Students | 2.8 miles away | Not Yet Rated | |
| Garden Grove High School 9-12 | 2,306 Students | 3.0 miles away | Not Yet Rated | |
| Valley High School 9-12 | 2,465 Students | 3.0 miles away |  5 out of 5 | |
| Ocean View High School 9-12 | 1,489 Students | 3.4 miles away | Not Yet Rated | |
| Westminster High School 9-12 | 2,747 Students | 3.6 miles away |  3 out of 5 | |
| Segerstrom High School 9-12 | 2,408 Students | 3.9 miles away | 5 out of 5 | |
Compare This School To Nearby Schools ->
School Community Forum

Join a discussion about La Quinta High School and talk to others in the community including students, parents, teachers, and administrators.
Popular Discussion Topics
- Admissions and Registration Questions (e.g. Dress Code and Discipline Policy)
- School Calendar and Upcoming Events (e.g. Graduation)
- After School Programs, Extracurricular Activities, and Athletics (e.g. Football)
- News and Announcements (e.g. Yearbook and Class Supply List Details)
- Graduate and Alumni Events (e.g. Organizing Class Reunions)
Navigation
Can't Find What You Are Looking For?
Rankings
Nearby Cities
Sponsored Links
K-12 Articles

Just a Harmless Vanilla Bean?
Some of the greatest, most used, and most profitable breakthroughs in science have not been made by...
Some of the greatest, most used, and most profitable breakthroughs in science have not been made by...

Internet Safety for Kids of All Ages
Kids are being introduced to the Internet at a very young age. Research for homework and school...
Kids are being introduced to the Internet at a very young age. Research for homework and school...

Strategies to Help Kids Cope with Stress
Many parents believe that kids don't experience stress. Nothing could be further from the truth....
Many parents believe that kids don't experience stress. Nothing could be further from the truth....