Shasta Lake Alternative School
Rating
Not Available
Not Available

5 out of 5 | 1 Review
Find Old Friends From Shasta Lake Alternative School
Use the form below to search for alumni from Shasta Lake Alternative School.
School Description
School Summary and Highlights
- Enrolls 61 elementary, middle, and high school students from grades KG-12
- 2010 Overall School AYP Met Status: Yes
Additional Contact Information
- Mailing Address: 4411 Mountain Lakes Blvd., Redding, CA 96003
School Operational Details
- Alternative School
School District Details
- Gateway Unified School District
- Per-Pupil Spending: $9,846
- Graduation Rate: 73.1%
- Dropout Rate: 0.9%
- Students Per Teacher: 19.2
- Enrolled Students: 3,916
Faculty Details and Student Enrollment
Students and Faculty
- Total Students Enrolled: 61
- Total Full Time "Equivalent" Teachers: 2.4
- Average Student-To-Teacher Ratio: 25.4
Students Gender Breakdown
- Males: 26 (42.6%)
- Females: 35 (57.4%)
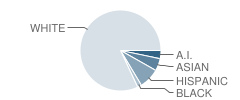
Student Enrollment Distribution by Race / Ethnicity
| Number | Percent | |
|---|---|---|
| American Indian | 2 | 3.3% |
| Black | 1 | 1.6% |
| Asian | 3 | 4.9% |
| Hispanic | 5 | 8.2% |
| White | 50 | 82.0% |
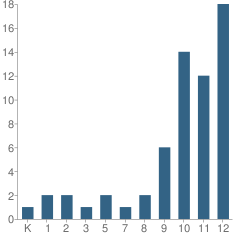
Number of Students Per Grade
| Number | Percent | |
|---|---|---|
| Kindergarten | 1 | 1.6% |
| 1st Grade | 2 | 3.3% |
| 2nd Grade | 2 | 3.3% |
| 3rd Grade | 1 | 1.6% |
| 5th Grade | 2 | 3.3% |
| 7th Grade | 1 | 1.6% |
| 8th Grade | 2 | 3.3% |
| 9th Grade | 6 | 9.8% |
| 10th Grade | 14 | 23.0% |
| 11th Grade | 12 | 19.7% |
| 12th Grade | 18 | 29.5% |
Teacher Credentials & Experience (2009)
Percent of Teachers With Credentials: 100.0%
Number of Certificated Staff: 3.0
Average Number of Years of Teacher Experience: 16.0
Average Age
School:
50.3
District:
53.6
Source: CA Department of Education, Source: NCES 2009-2010
School Ratings and Reviews
Overall Rating: 5

5 out of 5 | 1 Review
The Overall Rating is the school's average rating from parents, students, school faculty and staff. The highest rating is five apples and the lowest is one apple.
Share Your Review About This School
1 review for Shasta Lake Alternative School
- Reviewed by on September 05, 2006
- Rating:
 (5 / 5) Flag as inappropriate
 - Shasta Lake Alternative School's homeschool facillitator, Heidi Hillesheim, has always put our son's best interest first. She is very talented at nurturing student self-direction. She is dedicated to empowering homeschooling families. She exemplifies integrity in everything she does. We feel extrememly fortunate, after 12 years of searching for a quality homeschooling program, to have the privelege of Heidi Hillesheim's influence on our son's education. Thank you Shasta Lake Alternative School.
School Map and Similar Schools Nearby
Click to Activate Map of Nearby School Campuses
Private
Public
This School
Similar Schools Nearby
| Gateway Community Day School 7-9 | 11 Students | 0 miles away | Not Yet Rated | |
| Education Resource Center School 9-12 | 35 Students | 4.0 miles away | Not Yet Rated | - |
| North State Independence High School 9-12 | 262 Students | 6.8 miles away | Not Yet Rated | |
| Pioneer High School 9-12 | 176 Students | 6.9 miles away | Not Yet Rated | |
| Shasta Plus School 11-12 | 46 Students | 7.1 miles away | Not Yet Rated | - |
| Magnolia Independent Learning Center School 7-12 | 25 Students | 7.4 miles away | Not Yet Rated | - |
| Shasta County Alternative / Opportunity School KG-12 | 2 Students | 7.5 miles away | Not Yet Rated | - |
| Freedom High School 9-12 | 26 Students | 7.8 miles away | Not Yet Rated | |
| Enterprise Plus School 11-12 | 46 Students | 9.1 miles away | Not Yet Rated | - |
| Shasta County Juvenile Court School 7-12 | 40 Students | 9.7 miles away | Not Yet Rated | |
Compare This School To Nearby Schools ->
Navigation
Can't Find What You Are Looking For?
Rankings
Nearby Cities
Sponsored Links
K-12 Articles

Teachers Packing Heat
After the recent school shootings (and thwarted school shootings) in the past month-just as after...
After the recent school shootings (and thwarted school shootings) in the past month-just as after...

Preparing Your Child for the First Day of School
It seems like school was just dismissed for the summer, yet here we are facing another year of back...
It seems like school was just dismissed for the summer, yet here we are facing another year of back...

Keep Your Licensed Teen Safe This Summer
Every year hundreds of teenage drivers lose their lives in motor vehicle accidents. Statistics show...
Every year hundreds of teenage drivers lose their lives in motor vehicle accidents. Statistics show...