Central Valley High School

No Reviews Yet
Find Old Friends From Central Valley High School
Use the form below to search for alumni from Central Valley High School.
School Description
School Summary and Highlights
- Enrolls 875 high school students from grades 9-12
- Ranks 595th out of 1,197 high schools in CA.
- 2010 Overall School AYP Met Status: No
Additional Contact Information
- Mailing Address: 4411 Mountain Lakes Blvd., Redding, CA 96003
School District Details
- Gateway Unified School District
- Per-Pupil Spending: $9,846
- Graduation Rate: 73.1%
- Dropout Rate: 0.9%
- Students Per Teacher: 19.2
- Enrolled Students: 3,916
Faculty Details and Student Enrollment
Students and Faculty
- Total Students Enrolled: 875
- Total Full Time "Equivalent" Teachers: 35.2
- Average Student-To-Teacher Ratio: 24.9
Students Gender Breakdown
- Males: 471 (53.8%)
- Females: 404 (46.2%)
Free Lunch Student Eligibility Breakdown
- Eligible for Reduced Lunch: 107 (12.2%)
- Eligible for Free Lunch: 405 (46.3%)
- Eligible for Either Reduced or Free Lunch: 512 (58.5%)
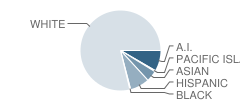
Student Enrollment Distribution by Race / Ethnicity

| Number | Percent | |
|---|---|---|
| American Indian | 73 | 8.3% |
| Black | 4 | 0.5% |
| Asian | 39 | 4.5% |
| Hispanic | 68 | 7.8% |
| White | 679 | 77.6% |
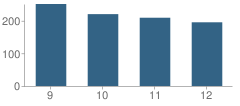
Number of Students Per Grade

| Number | Percent | |
|---|---|---|
| 9th Grade | 251 | 28.7% |
| 10th Grade | 220 | 25.1% |
| 11th Grade | 209 | 23.9% |
| 12th Grade | 195 | 22.3% |
Graduates Information (2010)
Graduation Rate
School:
96.8%
District:
93.9%
State:
78.6%
Teacher Education Background (2009)
Percent With Master's Degree
School:
20.0%
District:
20.0%
Teacher Credentials & Experience (2009)
Percent of Teachers With Credentials: 97.2%
Number of Certificated Staff: 45.0
Average Number of Years of Teacher Experience: 17.4
Average Age
School:
46.1
District:
53.6
Source: CA Department of Education, Source: NCES 2009-2010
School Ratings and Reviews
Be The First To Review Central Valley High School!
Sponsored Links
Test Scores and Performance Information
Overall School Rating
How is this determined?
The overall school rating shows that Central Valley High School performed on average about the same as other schools across the state on CST state exams in the following subjects:
- CST Algebra I
- CST Algebra II
- CST Biology
- CST Chemistry
- CST Earth Science
- CST English-Language Arts
- CST General Mathematics
- CST Geometry
- CST Integrated Math 2
- CST Physics
- CST Science
- CST Summative High School Math
- CST U.S. History
- CST World History
AYP Results (2010)
Overall AYP Met: No
ELA AYP Met: No
Math AYP Met: Yes
ACT Exam Results (2009)
Percent of Students Taking ACT Exam: 16.0%
Average Combined Score: 21.0
Percent Scoring At or Above 21: 44.4%
SAT Exam Results (2009)
Percent of Students Taking SAT Exam: 21.3%
Average Combined Score: 1,433.1
Critical Reading Average: 483.6
Math Average: 492.5
Writing Average: 456.9
Percent Scoring At or Above 1500: 30.6%
CST - Test Proficiency by Grade and Subject
Grade 9 - % of students at or above proficiency
| School | District | State | |
|---|---|---|---|
| CST Algebra I Test | |||
| 2010 | 11.0% | 11.0% | 22.0% |
| 2009 | 6.0% | 7.0% | 21.0% |
| 2008 | 10.0% | 9.0% | 18.0% |
| CST Biology Test | |||
| 2010 | 83.0% | 83.0% | 55.0% |
| 2009 | 58.0% | 60.0% | 51.0% |
| 2008 | 77.0% | 77.0% | 52.0% |
| CST Earth Science Test | |||
| 2010 | 47.0% | 47.0% | 35.0% |
| 2009 | 41.0% | 39.0% | 29.0% |
| 2008 | 51.0% | 47.0% | 31.0% |
| CST English-Language Arts Test | |||
| 2010 | 57.0% | 57.0% | 54.0% |
| 2009 | 62.0% | 60.0% | 50.0% |
| 2008 | 61.0% | 59.0% | 49.0% |
| CST Geometry Test | |||
| 2010 | 30.0% | 31.0% | 46.0% |
| 2009 | 29.0% | 29.0% | 47.0% |
| 2008 | 22.0% | 22.0% | 43.0% |
| CST General Mathematics Test | |||
| 2008 | 4.0% | 8.0% | 18.0% |
Grade 10 - % of students at or above proficiency
| School | District | State | |
|---|---|---|---|
| CST Algebra I Test | |||
| 2010 | 14.0% | 6.0% | 12.0% |
| 2009 | - | - | - |
| 2008 | 14.0% | 11.0% | 9.0% |
| CST Algebra II Test | |||
| 2010 | 30.0% | 30.0% | 40.0% |
| 2009 | 3.0% | 3.0% | 37.0% |
| 2008 | 21.0% | 21.0% | 36.0% |
| CST Biology Test | |||
| 2010 | 34.0% | 31.0% | 38.0% |
| 2009 | 33.0% | 28.0% | 34.0% |
| 2008 | 40.0% | 34.0% | 35.0% |
| CST Chemistry Test | |||
| 2010 | 43.0% | 41.0% | 47.0% |
| 2009 | 43.0% | 43.0% | 44.0% |
| 2008 | 54.0% | 54.0% | 41.0% |
| CST English-Language Arts Test | |||
| 2010 | 56.0% | 47.0% | 45.0% |
| 2009 | 51.0% | 45.0% | 44.0% |
| 2008 | 43.0% | 39.0% | 41.0% |
| CST Geometry Test | |||
| 2010 | 9.0% | 9.0% | 14.0% |
| 2009 | 7.0% | 7.0% | 14.0% |
| 2008 | 10.0% | 10.0% | 12.0% |
| CST Science Test | |||
| 2010 | 48.0% | 42.0% | 46.0% |
| 2009 | 51.0% | 44.0% | 44.0% |
| 2008 | 43.0% | 37.0% | 40.0% |
| CST World History Test | |||
| 2010 | 32.0% | 29.0% | 42.0% |
| 2009 | 40.0% | 34.0% | 38.0% |
| 2008 | 35.0% | 32.0% | 33.0% |
Grade 11 - % of students at or above proficiency
| School | District | State | |
|---|---|---|---|
| CST Algebra II Test | |||
| 2010 | 7.0% | 7.0% | 14.0% |
| 2009 | 2.0% | 2.0% | 12.0% |
| 2008 | 10.0% | 10.0% | 11.0% |
| CST Biology Test | |||
| 2010 | 27.0% | 11.0% | 46.0% |
| 2009 | 39.0% | 22.0% | 41.0% |
| 2008 | 36.0% | 26.0% | 39.0% |
| CST Chemistry Test | |||
| 2010 | 35.0% | 35.0% | 30.0% |
| 2009 | 31.0% | 30.0% | 27.0% |
| 2008 | 27.0% | 27.0% | 25.0% |
| CST Earth Science Test | |||
| 2010 | 58.0% | 34.0% | 32.0% |
| 2009 | 50.0% | 33.0% | 26.0% |
| 2008 | 42.0% | 34.0% | 28.0% |
| CST English-Language Arts Test | |||
| 2010 | 46.0% | 38.0% | 42.0% |
| 2009 | 44.0% | 38.0% | 40.0% |
| 2008 | 42.0% | 33.0% | 37.0% |
| CST Geometry Test | |||
| 2010 | 13.0% | 12.0% | 6.0% |
| 2009 | 5.0% | 5.0% | 7.0% |
| 2008 | 10.0% | 9.0% | 6.0% |
| CST Integrated Math 2 Test | |||
| 2010 | 33.0% | 33.0% | 19.0% |
| 2009 | 18.0% | 18.0% | 15.0% |
| CST Physics Test | |||
| 2010 | 55.0% | 55.0% | 53.0% |
| CST Summative High School Math Test | |||
| 2010 | 12.0% | 12.0% | 50.0% |
| 2009 | 22.0% | 22.0% | 47.0% |
| 2008 | 40.0% | 40.0% | 43.0% |
| CST U.S. History Test | |||
| 2010 | 54.0% | 44.0% | 45.0% |
| 2009 | 52.0% | 44.0% | 44.0% |
| 2008 | 37.0% | 32.0% | 38.0% |
| CST Algebra I Test | |||
| 2009 | 9.0% | 10.0% | 8.0% |
| 2008 | 14.0% | 8.0% | 5.0% |
End of Course - % of students at or above proficiency
| School | District | State | |
|---|---|---|---|
| CST Algebra I Test | |||
| 2010 | 12.0% | 19.0% | 31.0% |
| 2009 | 5.0% | 15.0% | 28.0% |
| 2008 | 11.0% | 13.0% | 25.0% |
| CST Algebra II Test | |||
| 2010 | 15.0% | 15.0% | 31.0% |
| 2009 | 5.0% | 5.0% | 28.0% |
| 2008 | 16.0% | 16.0% | 27.0% |
| CST Biology Test | |||
| 2010 | 46.0% | 38.0% | 46.0% |
| 2009 | 38.0% | 32.0% | 42.0% |
| 2008 | 48.0% | 42.0% | 42.0% |
| CST Chemistry Test | |||
| 2010 | 38.0% | 38.0% | 38.0% |
| 2009 | 36.0% | 36.0% | 36.0% |
| 2008 | 34.0% | 34.0% | 32.0% |
| CST Earth Science Test | |||
| 2010 | 48.0% | 42.0% | 33.0% |
| 2009 | 42.0% | 37.0% | 28.0% |
| 2008 | 46.0% | 39.0% | 28.0% |
| CST Geometry Test | |||
| 2010 | 16.0% | 18.0% | 27.0% |
| 2009 | 12.0% | 15.0% | 26.0% |
| 2008 | 14.0% | 15.0% | 24.0% |
| CST Integrated Math 2 Test | |||
| 2010 | 34.0% | 34.0% | 27.0% |
| 2009 | 20.0% | 20.0% | 25.0% |
| CST Physics Test | |||
| 2010 | 58.0% | 58.0% | 49.0% |
| CST Summative High School Math Test | |||
| 2010 | 26.0% | 26.0% | 54.0% |
| 2009 | 21.0% | 21.0% | 50.0% |
| 2008 | 41.0% | 41.0% | 47.0% |
| CST World History Test | |||
| 2010 | 31.0% | 28.0% | 41.0% |
| 2009 | 39.0% | 34.0% | 38.0% |
| 2008 | 35.0% | 31.0% | 33.0% |
| CST General Mathematics Test | |||
| 2008 | 4.0% | 15.0% | 27.0% |
Source: CA Department of Education 2009-2010
School Map and Similar Schools Nearby
Click to Activate Map of Nearby School Campuses
Private
Public
This School
Similar Schools Nearby
| Shasta High School 9-12 | 1,604 Students | 6.6 miles away | ![]() 5 out of 5 | |
| Parsons Junior High School 6-8 | 630 Students | 7.9 miles away | ![]() 3 out of 5 | |
| Enterprise High School 9-12 | 1,294 Students | 8.3 miles away | Not Yet Rated | |
| Foothill High School 9-12 | 1,437 Students | 12.5 miles away | Not Yet Rated | |
| Anderson High School 9-12 | 700 Students | 16.7 miles away | Not Yet Rated | |
| West Valley High School 9-12 | 907 Students | 19.5 miles away | Not Yet Rated | |
| West Cottonwood Junior High School 6-8 | 340 Students | 20.8 miles away | ![]() 4 out of 5 | |
| Black Butte Junior High School 7-8 | 27 Students | 26.0 miles away | Not Yet Rated | |
Compare This School To Nearby Schools ->
School Community Forum

Join a discussion about Central Valley High School and talk to others in the community including students, parents, teachers, and administrators.
Popular Discussion Topics
- Admissions and Registration Questions (e.g. Dress Code and Discipline Policy)
- School Calendar and Upcoming Events (e.g. Graduation)
- After School Programs, Extracurricular Activities, and Athletics (e.g. Football)
- News and Announcements (e.g. Yearbook and Class Supply List Details)
- Graduate and Alumni Events (e.g. Organizing Class Reunions)
Navigation
Can't Find What You Are Looking For?
Rankings
Nearby Cities
Sponsored Links
K-12 Articles
Grammar...not Just Extended Family Anymore!
Can I talk to y'all abit about grammar? Right grammar and punctuations got to be some of the...
The Cervical Cancer Vaccine
All across North America girls between the ages of 11 and 12 have the opportunity to be vaccinated...
Just a Harmless Vanilla Bean?
Some of the greatest, most used, and most profitable breakthroughs in science have not been made by...


