Lopez High School
3205 South Dakota Ave, Brownsville, TX 78521 | (956) 982-7400
- Grades: 9-12
- Student Enrollment: 2,239
Rating
Not Available
Not Available

1 out of 5 | 1 Review
Find Old Friends From Lopez High School
Use the form below to search for alumni from Lopez High School.
School Description
School Summary and Highlights
- Enrolls 2,239 high school students from grades 9-12
- Ranks 1041st out of 1,325 high schools in TX.
- 2010 Overall School AYP Met Status: Yes
Additional Contact Information
- Mailing Address: 3205 S Dakota Ave, Brownsville, TX 78521
- Principal or Admin: Ms Dawn Hall
- Fax: (956) 982-7499
- Website: www.bisd.us
School Operational Details
- Title I EligibleAll students of this school are eligible for participation in authorized programs.
School District Details
- Brownsville Independent School District (ISD)
- Per-Pupil Spending: $8,659
- Graduation Rate: 62.2%
- Dropout Rate: 4.6%
- Students Per Teacher: 14.6
- Enrolled Students: 49,121
Faculty Details and Student Enrollment
Students and Faculty
- Total Students Enrolled: 2,239
- Total Full Time "Equivalent" Teachers: 159.9
- Average Student-To-Teacher Ratio: 14.0
Students Gender Breakdown
- Males: 1,144 (51.1%)
- Females: 1,095 (48.9%)
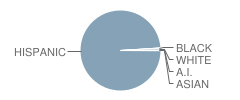
Student Enrollment Distribution by Race / Ethnicity
| Number | Percent | |
|---|---|---|
| American Indian | 1 | 0.04% |
| Black | 1 | 0.04% |
| Asian | 1 | 0.04% |
| Hispanic | 2,214 | 98.9% |
| White | 22 | 1.0% |
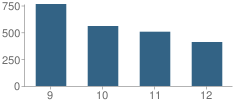
Number of Students Per Grade
| Number | Percent | |
|---|---|---|
| 9th Grade | 764 | 34.1% |
| 10th Grade | 559 | 25.0% |
| 11th Grade | 506 | 22.6% |
| 12th Grade | 410 | 18.3% |
Breakdown of College Ready Graduates (2009)
Percent Ready For College in Reading
School:
41.0%
District:
47.0%
State:
62.0%
Percent Ready For College in Math
School:
52.0%
District:
31.0%
State:
60.0%
Graduation & Dropout Rates (2009)
Graduation Rate
School:
74.8%
District:
76.5%
State:
80.6%
Dropout Rate
School:
10.9%
District:
9.3%
State:
9.4%
Faculty Breakdown (2010)
Average Teacher Experience
School:
10.4
District:
11.9
State:
11.3
Percent of Teachers With 1-5 Years Experience
School:
36.9%
District:
28.6%
State:
31.0%
Percent of Teachers With 6-10 Years Experience
School:
16.5%
District:
21.8%
State:
20.3%
Percent of Teachers With 11-20 Years Experience
School:
27.3%
District:
25.7%
State:
24.4%
Percent of Teachers With Greater Than 20 Years Experience
School:
14.2%
District:
20.1%
State:
18.3%
Faculty Salary (2010)
School Administration Average Base Salary
School:
$65,418
District:
$67,218
State:
$70,209
Teacher Average Base Salary
School:
$47,073
District:
$48,412
State:
$48,263
Beginning Teacher Average Base Salary
School:
$39,420
District:
$39,147
State:
$41,165
Teacher With 1-5 Years Experience Average Base Salary
School:
$41,398
State:
$43,527
Teacher With 6-10 Years Experience Average Base Salary
School:
$44,824
State:
$46,149
Teacher With 11-20 Years Experience Average Base Salary
School:
$50,904
State:
$50,153
Teacher With Greater Than 20 Years Experience Average Base Salary
School:
$59,742
State:
$58,427
Source: TX Department of Education, Source: NCES 2009-2010
School Ratings and Reviews
Overall Rating: 1

1 out of 5 | 1 Review
The Overall Rating is the school's average rating from parents, students, school faculty and staff. The highest rating is five apples and the lowest is one apple.
Share Your Review About This School
1 review for Lopez High School
- Reviewed by Parent/Guardian on October 21, 2010
- Rating:
 (1 / 5) Flag as inappropriate
 - this school is horrible.
School Map and Similar Schools Nearby
Click to Activate Map of Nearby School Campuses
Private
Public
This School
Similar Schools Nearby
| Porter High School 9-12 | 2,447 Students | 3.8 miles away | Not Yet Rated | |
| Rivera High School 9-12 | 2,257 Students | 4.0 miles away |  5 out of 5 | |
| Hanna High School 9-12 | 3,184 Students | 5.0 miles away | Not Yet Rated | |
| Brownsville Early College High School 9-10 | 185 Students | 5.4 miles away | Not Yet Rated | |
| Pace High School 9-12 | 2,557 Students | 7.3 miles away |  2 out of 5 | |
| Los Fresnos United School 9 | 692 Students | 13.3 miles away | Not Yet Rated | |
| Los Fresnos High School 9-12 | 1,856 Students | 14.0 miles away | Not Yet Rated | |
| Port Isabel Junior High School 6-8 | 523 Students | 18.8 miles away | Not Yet Rated | |
| San Benito High School 10-12 | 1,907 Students | 23.0 miles away | Not Yet Rated | |
| San Benito Veterans Memorial Academy 9 | 763 Students | 23.4 miles away | Not Yet Rated | |
Compare This School To Nearby Schools ->
School Community Forum

Join a discussion about Lopez High School and talk to others in the community including students, parents, teachers, and administrators.
Popular Discussion Topics
- Admissions and Registration Questions (e.g. Dress Code and Discipline Policy)
- School Calendar and Upcoming Events (e.g. Graduation)
- After School Programs, Extracurricular Activities, and Athletics (e.g. Football)
- News and Announcements (e.g. Yearbook and Class Supply List Details)
- Graduate and Alumni Events (e.g. Organizing Class Reunions)
Navigation
Can't Find What You Are Looking For?
Nearby Cities
Sponsored Links
K-12 Articles

The Importance of Reading for Children Preschool to Grade Three
The first teachers of children are their parents. From the time they are infants, children need to...
The first teachers of children are their parents. From the time they are infants, children need to...

Information on Cyberbullying
What is Cyberbullying? Cyberbullying is a new form of harassment, emotional abuse,...
What is Cyberbullying? Cyberbullying is a new form of harassment, emotional abuse,...

Grammar...not Just Extended Family Anymore!
Can I talk to y'all abit about grammar? Right grammar and punctuations got to be some of the...
Can I talk to y'all abit about grammar? Right grammar and punctuations got to be some of the...