Bynum School
Rating
Not Available
Not Available

No Reviews Yet
Find Old Friends From Bynum School
Use the form below to search for alumni from Bynum School.
School Description
School Summary and Highlights
- Enrolls 233 school students from grades PK-12
- Ranks 342nd out of 1,325 high schools in TX.
- 2010 Overall School AYP Met Status: Yes
Additional Contact Information
- Mailing Address: P O Box 68, Bynum, TX 76631
- Principal or Admin: Mrs Amy J Feller
- Fax: (254) 623-4290
- Website: www.bynumisd.net
School Operational Details
- Title I EligibleAll students of this school are eligible for participation in authorized programs.
School District Details
- Bynum Independent School District (ISD)
- Per-Pupil Spending: $8,722
- Graduation Rate: 100.0%
- Students Per Teacher: 10.8
- Enrolled Students: 233
Faculty Details and Student Enrollment
Students and Faculty
- Total Students Enrolled: 233
- Total Full Time "Equivalent" Teachers: 21.6
- Average Student-To-Teacher Ratio: 10.8
Students Gender Breakdown
- Males: 124 (53.2%)
- Females: 109 (46.8%)
Free Lunch Student Eligibility Breakdown
- Eligible for Reduced Lunch: 23 (9.9%)
- Eligible for Free Lunch: 96 (41.2%)
- Eligible for Either Reduced or Free Lunch: 119 (51.1%)
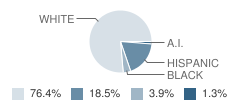
Student Enrollment Distribution by Race / Ethnicity
| Number | Percent | |
|---|---|---|
| American Indian | 3 | 1.3% |
| Black | 9 | 3.9% |
| Asian | - | - |
| Hispanic | 43 | 18.5% |
| White | 178 | 76.4% |
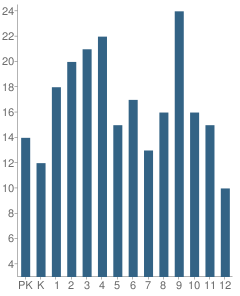
Number of Students Per Grade
| Number | Percent | |
|---|---|---|
| Pre-Kindergarten | 14 | 6.0% |
| Kindergarten | 12 | 5.2% |
| 1st Grade | 18 | 7.7% |
| 2nd Grade | 20 | 8.6% |
| 3rd Grade | 21 | 9.0% |
| 4th Grade | 22 | 9.4% |
| 5th Grade | 15 | 6.4% |
| 6th Grade | 17 | 7.3% |
| 7th Grade | 13 | 5.6% |
| 8th Grade | 16 | 6.9% |
| 9th Grade | 24 | 10.3% |
| 10th Grade | 16 | 6.9% |
| 11th Grade | 15 | 6.4% |
| 12th Grade | 10 | 4.3% |
Breakdown of College Ready Graduates (2009)
Percent Ready For College in Reading
School:
80.0%
District:
80.0%
State:
62.0%
Percent Ready For College in Math
School:
60.0%
State:
60.0%
Graduation & Dropout Rates (2009)
Graduation Rate
School:
100.0%
District:
100.0%
State:
80.6%
Faculty Breakdown (2010)
Average Teacher Experience
School:
11.1
District:
11.1
State:
11.3
Percent of Teachers With 1-5 Years Experience
School:
27.8%
District:
27.8%
State:
31.0%
Percent of Teachers With 6-10 Years Experience
School:
13.9%
District:
13.9%
State:
20.3%
Percent of Teachers With 11-20 Years Experience
School:
28.8%
District:
28.8%
State:
24.4%
Percent of Teachers With Greater Than 20 Years Experience
School:
20.2%
District:
20.2%
State:
18.3%
Faculty Salary (2010)
School Administration Average Base Salary
School:
$47,554
District:
$47,554
State:
$70,209
Teacher Average Base Salary
School:
$38,036
District:
$38,036
State:
$48,263
Beginning Teacher Average Base Salary
School:
$33,810
District:
$33,810
State:
$41,165
Teacher With 1-5 Years Experience Average Base Salary
School:
$28,864
State:
$43,527
Teacher With 6-10 Years Experience Average Base Salary
School:
$35,522
State:
$46,149
Teacher With 11-20 Years Experience Average Base Salary
School:
$42,536
State:
$50,153
Teacher With Greater Than 20 Years Experience Average Base Salary
School:
$47,919
State:
$58,427
Source: TX Department of Education, Source: NCES 2009-2010
School Ratings and Reviews
Be The First To Review Bynum School!
School Map and Similar Schools Nearby
Click to Activate Map of Nearby School Campuses
Private
Public
This School
Similar Schools Nearby
| Abbott School PK-12 | 297 Students | 7.4 miles away | Not Yet Rated | |
| Hillsboro High School 9-12 | 450 Students | 7.7 miles away | Not Yet Rated | |
| Hillsboro Junior High School 7-8 | 237 Students | 8.0 miles away | Not Yet Rated | |
| Penelope School PK-12 | 196 Students | 8.4 miles away | Not Yet Rated | |
| Milford School PK-12 | 254 Students | 10.9 miles away | Not Yet Rated | |
| West High School 9-12 | 468 Students | 11.1 miles away |  5 out of 5 | |
| Frost High School 6-12 | 178 Students | 13.5 miles away | Not Yet Rated | |
| Hubbard High School 9-12 | 127 Students | 14.3 miles away |  3 out of 5 | |
| Aquilla School PK-12 | 237 Students | 15.1 miles away | Not Yet Rated | |
| Itasca High School 9-12 | 186 Students | 15.9 miles away |  1 out of 5 | |
Compare This School To Nearby Schools ->
School Community Forum

Join a discussion about Bynum School and talk to others in the community including students, parents, teachers, and administrators.
Popular Discussion Topics
- Admissions and Registration Questions (e.g. Dress Code and Discipline Policy)
- School Calendar and Upcoming Events (e.g. Graduation)
- After School Programs, Extracurricular Activities, and Athletics (e.g. Football)
- News and Announcements (e.g. Yearbook and Class Supply List Details)
- Graduate and Alumni Events (e.g. Organizing Class Reunions)
Navigation
Can't Find What You Are Looking For?
Nearby Cities
Sponsored Links
K-12 Articles

The Difference Between Boys and Girls
Boys and girls are different. Give a toddler girl a G.I. Joe and she'll probably try to mother it....
Boys and girls are different. Give a toddler girl a G.I. Joe and she'll probably try to mother it....

Siblings and Individual Identity in High School
When the first day of high school looms in the near future, teens are both excited and anxious....
When the first day of high school looms in the near future, teens are both excited and anxious....

Information on Cyberbullying
What is Cyberbullying? Cyberbullying is a new form of harassment, emotional abuse,...
What is Cyberbullying? Cyberbullying is a new form of harassment, emotional abuse,...