Lumberton High School
Rating
Not Available
Not Available

No Reviews Yet
Find Old Friends From Lumberton High School
Use the form below to search for alumni from Lumberton High School.
School Description
School Summary and Highlights
- Enrolls 1,062 high school students from grades 9-12
- Ranks 323rd out of 1,325 high schools in TX.
- 2010 Overall School AYP Met Status: Yes
Additional Contact Information
- Mailing Address: 103 S Lhs Dr, Lumberton, TX 77657
- Principal or Admin: Mr John Valastro
- Fax: (409) 755-6576
- Website: www.lumberton.k12.tx.us
School Operational Details
- Title I Eligible
School District Details
- Lumberton Independent School District (ISD)
- Per-Pupil Spending: $7,397
- Graduation Rate: 87.0%
- Dropout Rate: 1.7%
- Students Per Teacher: 13.9
- Enrolled Students: 3,900
Faculty Details and Student Enrollment
Students and Faculty
- Total Students Enrolled: 1,062
- Total Full Time "Equivalent" Teachers: 89.2
- Average Student-To-Teacher Ratio: 11.9
Students Gender Breakdown
- Males: 509 (47.9%)
- Females: 553 (52.1%)
Free Lunch Student Eligibility Breakdown
- Eligible for Reduced Lunch: 63 (5.9%)
- Eligible for Free Lunch: 213 (20.1%)
- Eligible for Either Reduced or Free Lunch: 276 (26.0%)
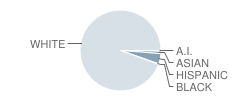
Student Enrollment Distribution by Race / Ethnicity
| Number | Percent | |
|---|---|---|
| American Indian | 3 | 0.3% |
| Black | 2 | 0.2% |
| Asian | 10 | 0.9% |
| Hispanic | 44 | 4.1% |
| White | 1,003 | 94.4% |
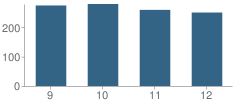
Number of Students Per Grade
| Number | Percent | |
|---|---|---|
| 9th Grade | 274 | 25.8% |
| 10th Grade | 279 | 26.3% |
| 11th Grade | 259 | 24.4% |
| 12th Grade | 250 | 23.5% |
Breakdown of College Ready Graduates (2009)
Percent Ready For College in Reading
School:
63.0%
District:
63.0%
State:
62.0%
Percent Ready For College in Math
School:
56.0%
District:
46.0%
State:
60.0%
Graduation & Dropout Rates (2009)
Graduation Rate
School:
90.2%
District:
90.2%
State:
80.6%
Dropout Rate
School:
5.1%
District:
5.1%
State:
9.4%
Faculty Breakdown (2010)
Average Teacher Experience
School:
10.6
District:
11.7
State:
11.3
Percent of Teachers With 1-5 Years Experience
School:
29.2%
District:
28.8%
State:
31.0%
Percent of Teachers With 6-10 Years Experience
School:
26.9%
District:
21.4%
State:
20.3%
Percent of Teachers With 11-20 Years Experience
School:
26.9%
District:
26.0%
State:
24.4%
Percent of Teachers With Greater Than 20 Years Experience
School:
12.5%
District:
18.5%
State:
18.3%
Faculty Salary (2010)
School Administration Average Base Salary
School:
$70,613
District:
$67,765
State:
$70,209
Teacher Average Base Salary
School:
$41,224
District:
$41,468
State:
$48,263
Beginning Teacher Average Base Salary
School:
$35,654
District:
$33,750
State:
$41,165
Teacher With 1-5 Years Experience Average Base Salary
School:
$35,178
State:
$43,527
Teacher With 6-10 Years Experience Average Base Salary
School:
$39,602
State:
$46,149
Teacher With 11-20 Years Experience Average Base Salary
School:
$45,921
State:
$50,153
Teacher With Greater Than 20 Years Experience Average Base Salary
School:
$50,730
State:
$58,427
Source: TX Department of Education, Source: NCES 2009-2010
School Ratings and Reviews
Be The First To Review Lumberton High School!
School Map and Similar Schools Nearby
Click to Activate Map of Nearby School Campuses
Private
Public
This School
Similar Schools Nearby
| Silsbee High School 9-12 | 859 Students | 7.7 miles away |  1.5 out of 5 | |
| Evadale High School 9-12 | 138 Students | 10.3 miles away | Not Yet Rated | |
| Evadale Junior High School 6-8 | 100 Students | 10.4 miles away | Not Yet Rated | |
| Evadale Elementary / Jr High School PK-5 | 212 Students | 10.4 miles away |  5 out of 5 | |
| Kountze High School 9-12 | 382 Students | 11.3 miles away | Not Yet Rated | |
| West Brook Sr High School 9-12 | 2,463 Students | 12.5 miles away |  3 out of 5 | |
| Central High School 9-12 | 1,596 Students | 13.3 miles away | Not Yet Rated | |
| Hardin-Jefferson High School 9-12 | 582 Students | 14.3 miles away | 5 out of 5 | |
| Vidor Junior High School 7-8 | 737 Students | 15.2 miles away | Not Yet Rated | |
| Ozen High School 9-12 | 1,205 Students | 15.3 miles away | 5 out of 5 | |
Compare This School To Nearby Schools ->
School Community Forum

Join a discussion about Lumberton High School and talk to others in the community including students, parents, teachers, and administrators.
Popular Discussion Topics
- Admissions and Registration Questions (e.g. Dress Code and Discipline Policy)
- School Calendar and Upcoming Events (e.g. Graduation)
- After School Programs, Extracurricular Activities, and Athletics (e.g. Football)
- News and Announcements (e.g. Yearbook and Class Supply List Details)
- Graduate and Alumni Events (e.g. Organizing Class Reunions)
Navigation
Can't Find What You Are Looking For?
Nearby Cities
Sponsored Links
K-12 Articles

Teaching Children a Love of History
Parents and grandparents are responsible for teaching children a love of history. To begin, relate...
Parents and grandparents are responsible for teaching children a love of history. To begin, relate...

Who is Safe?
Between September 26 and October 2, 2006, there were three deadly school shootings and...
Between September 26 and October 2, 2006, there were three deadly school shootings and...

Educators and Childhood Obesity
Obesity in childhood is rising to epidemic proportions in America and educators should be...
Obesity in childhood is rising to epidemic proportions in America and educators should be...