Whitcomb Continuation High School
Rating
Not Available
Not Available

No Reviews Yet
Find Old Friends From Whitcomb Continuation High School
Use the form below to search for alumni from Whitcomb Continuation High School.
School Description
School Summary and Highlights
- Enrolls 90 high school students from grades 9-12
- 2010 Overall School AYP Met Status: Yes
Additional Contact Information
- Mailing Address: 350 West Mauna Loa Ave., Glendora, CA 91740
School Operational Details
- Alternative School
School District Details
- Glendora Unified School District
- Per-Pupil Spending: $8,130
- Graduation Rate: 87.7%
- Dropout Rate: 1.6%
- Students Per Teacher: 24.6
- Enrolled Students: 7,015
Faculty Details and Student Enrollment
Students and Faculty
- Total Students Enrolled: 90
- Total Full Time "Equivalent" Teachers: 8.0
- Average Student-To-Teacher Ratio: 11.3
Students Gender Breakdown
- Males: 56 (62.2%)
- Females: 34 (37.8%)
Free Lunch Student Eligibility Breakdown
- Eligible for Reduced Lunch: 2 (2.2%)
- Eligible for Free Lunch: 29 (32.2%)
- Eligible for Either Reduced or Free Lunch: 31 (34.4%)
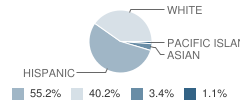
Student Enrollment Distribution by Race / Ethnicity
| Number | Percent | |
|---|---|---|
| American Indian | - | - |
| Black | - | - |
| Asian | 3 | 3.3% |
| Hispanic | 48 | 53.3% |
| White | 35 | 38.9% |
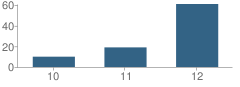
Number of Students Per Grade
| Number | Percent | |
|---|---|---|
| 10th Grade | 10 | 11.1% |
| 11th Grade | 19 | 21.1% |
| 12th Grade | 61 | 67.8% |
Graduates Information (2010)
Graduation Rate
School:
94.2%
District:
94.2%
State:
78.6%
Teacher Education Background (2009)
Percent With Master's Degree
School:
50.0%
District:
60.7%
Percent With Bachelor's Degree: 25.0%
Teacher Credentials & Experience (2009)
Percent of Teachers With Emergency Credentials: 14.3%
Percent of Teachers With Credentials: 71.4%
Number of Certificated Staff: 8.0
Average Number of Years of Teacher Experience: 11.6
Average Age
School:
62.0
District:
70.8
Source: CA Department of Education, Source: NCES 2009-2010
School Ratings and Reviews
Be The First To Review Whitcomb Continuation High School!
School Map and Similar Schools Nearby
Click to Activate Map of Nearby School Campuses
Private
Public
This School
Similar Schools Nearby
| Sierra High School 9-12 | 296 Students | 0.9 miles away | Not Yet Rated | |
| Bridges Community Day School 7-12 | 53 Students | 1.5 miles away | Not Yet Rated | |
| Fair Valley High (Continuation) School 9-12 | 254 Students | 1.7 miles away | Not Yet Rated | |
| Vista (Alternative) School KG-12 | 44 Students | 3.5 miles away | Not Yet Rated | |
| Chaparral High (Continuation) School 9-12 | 105 Students | 3.6 miles away | Not Yet Rated | |
| Mt. Olive Alternative Education School 9-12 | 74 Students | 5.1 miles away | Not Yet Rated | |
| Coronado Alternative School 9-12 | 252 Students | 5.8 miles away | Not Yet Rated | |
| Quest Academy Community Day 7-12 | 15 Students | 6.8 miles away | Not Yet Rated | - |
| Canyon Oaks High School 9-12 | 122 Students | 6.8 miles away | Not Yet Rated | |
| Park West High (Continuation) School 9-12 | 193 Students | 7.1 miles away | Not Yet Rated | |
Compare This School To Nearby Schools ->
Navigation
Can't Find What You Are Looking For?
Rankings
Nearby Cities
Sponsored Links
K-12 Articles

Tips for Easing Your Child's Back to School Stress
Do you remember the roller coaster of emotions that you experienced as a child when the day for...
Do you remember the roller coaster of emotions that you experienced as a child when the day for...

Cut the Credit and Save You Some Money
Today's society glorifies a get-it-now mentality. Children learn this early. You probably noticed...
Today's society glorifies a get-it-now mentality. Children learn this early. You probably noticed...

Parent-Teacher Conference Dos and Don'ts
Finals are over and done, and grades have arrived. Now comes the dreaded time to discuss the...
Finals are over and done, and grades have arrived. Now comes the dreaded time to discuss the...