Gold Trail School
Rating
Not Available
Not Available

No Reviews Yet
Find Old Friends From Gold Trail School
Use the form below to search for alumni from Gold Trail School.
School Description
School Summary and Highlights
- Enrolls 320 elementary school students from grades 4-8
- Ranks 304th out of 2,050 middle schools in CA.
- 2010 Overall School AYP Met Status: No
Additional Contact Information
- Mailing Address: 889 Cold Springs Rd., Placerville, CA 95667
School District Details
- Gold Trail Union Elementary School District
- Per-Pupil Spending: $8,359
- Students Per Teacher: 21.1
- Enrolled Students: 540
Faculty Details and Student Enrollment
Students and Faculty
- Total Students Enrolled: 320
- Total Full Time "Equivalent" Teachers: 14.6
- Average Student-To-Teacher Ratio: 21.9
Students Gender Breakdown
- Males: 169 (52.8%)
- Females: 151 (47.2%)
Free Lunch Student Eligibility Breakdown
- Eligible for Reduced Lunch: 14 (4.4%)
- Eligible for Free Lunch: 52 (16.3%)
- Eligible for Either Reduced or Free Lunch: 66 (20.6%)
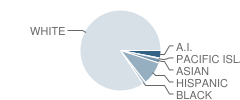
Student Enrollment Distribution by Race / Ethnicity
| Number | Percent | |
|---|---|---|
| American Indian | 10 | 3.1% |
| Black | 4 | 1.3% |
| Asian | 6 | 1.9% |
| Hispanic | 30 | 9.4% |
| White | 268 | 83.8% |
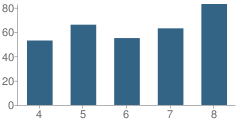
Number of Students Per Grade
| Number | Percent | |
|---|---|---|
| 4th Grade | 53 | 16.6% |
| 5th Grade | 66 | 20.6% |
| 6th Grade | 55 | 17.2% |
| 7th Grade | 63 | 19.7% |
| 8th Grade | 83 | 25.9% |
Teacher Education Background (2009)
Percent With Master's Degree: 38.9%
Percent With Bachelor's Degree: 11.1%
Teacher Credentials & Experience (2009)
Percent of Teachers With Credentials: 100.0%
Number of Certificated Staff: 18.0
Average Number of Years of Teacher Experience: 19.8
Average Age: 47.7
Source: CA Department of Education, Source: NCES 2009-2010
School Ratings and Reviews
Be The First To Review Gold Trail School!
School Map and Similar Schools Nearby
Click to Activate Map of Nearby School Campuses
Private
Public
This School
Similar Schools Nearby
| Sutter's Mill Primary School KG-3 | 220 Students | 2.1 miles away | Not Yet Rated | |
| Indian Creek Elementary School KG-5 | 436 Students | 3.7 miles away |  2 out of 5 | |
| Sierra Elementary School KG-5 | 449 Students | 6.1 miles away | Not Yet Rated | |
| Rescue Elementary School KG-5 | 426 Students | 6.1 miles away | Not Yet Rated | |
| Louisiana Schnell Elementary School KG-5 | 382 Students | 6.6 miles away | Not Yet Rated | |
| Charles F. Brown Elementary School KG-5 | 448 Students | 7.0 miles away | Not Yet Rated | |
| Buckeye Elementary School KG-5 | 464 Students | 7.2 miles away | Not Yet Rated | |
| Green Valley Elementary School KG-5 | 712 Students | 8.3 miles away | Not Yet Rated | |
| Northside Elementary School KG-8 | 519 Students | 9.9 miles away | Not Yet Rated | |
| Georgetown Elementary School KG-8 | 484 Students | 10.0 miles away | Not Yet Rated | |
Compare This School To Nearby Schools ->
School Community Forum

Join a discussion about Gold Trail School and talk to others in the community including students, parents, teachers, and administrators.
Popular Discussion Topics
- Admissions and Registration Questions (e.g. Dress Code and Discipline Policy)
- School Calendar and Upcoming Events (e.g. Graduation)
- After School Programs, Extracurricular Activities, and Athletics (e.g. Football)
- News and Announcements (e.g. Yearbook and Class Supply List Details)
- Graduate and Alumni Events (e.g. Organizing Class Reunions)
Navigation
Can't Find What You Are Looking For?
Rankings
Nearby Cities
Sponsored Links
K-12 Articles

Break the Cycle: Teen Dating Violence and Prevention Week
February 5 through 9 was "National Teen Dating Violence Awareness and Prevention Week"....
February 5 through 9 was "National Teen Dating Violence Awareness and Prevention Week"....

Assisting Students to Overcome Test Anxiety
Every human copes with anxiety at one time or another. It is a basic emotion that we feel when...
Every human copes with anxiety at one time or another. It is a basic emotion that we feel when...

Idle Hands
The worst affliction affecting our kids today is not teen pregnancy, drugs and alcohol, or...
The worst affliction affecting our kids today is not teen pregnancy, drugs and alcohol, or...