El Camino Elementary School
Rating
Not Available
Not Available

No Reviews Yet
Find Old Friends From El Camino Elementary School
Use the form below to search for alumni from El Camino Elementary School.
School Description
School Summary and Highlights
- Enrolls 306 elementary school students from grades KG-6
- Ranks 2511th out of 5,423 elementary schools in CA.
- 2010 Overall School AYP Met Status: Yes
Additional Contact Information
- Mailing Address: 5020 San Simeon Dr., Santa Barbara, CA 93111
School Operational Details
- Title I EligibleAll students of this school are eligible for participation in authorized programs.
School District Details
- Goleta Union Elementary School District
- Per-Pupil Spending: $11,082
- Students Per Teacher: 19.0
- Enrolled Students: 3,697
Faculty Details and Student Enrollment
Students and Faculty
- Total Students Enrolled: 306
- Total Full Time "Equivalent" Teachers: 16.0
- Average Student-To-Teacher Ratio: 19.1
Students Gender Breakdown
- Males: 156 (51.0%)
- Females: 150 (49.0%)
Free Lunch Student Eligibility Breakdown
- Eligible for Reduced Lunch: 65 (21.2%)
- Eligible for Free Lunch: 140 (45.8%)
- Eligible for Either Reduced or Free Lunch: 205 (67.0%)
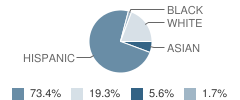
Student Enrollment Distribution by Race / Ethnicity
| Number | Percent | |
|---|---|---|
| American Indian | - | - |
| Black | 5 | 1.6% |
| Asian | 17 | 5.6% |
| Hispanic | 221 | 72.2% |
| White | 58 | 19.0% |
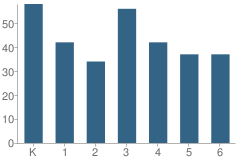
Number of Students Per Grade
| Number | Percent | |
|---|---|---|
| Kindergarten | 58 | 19.0% |
| 1st Grade | 42 | 13.7% |
| 2nd Grade | 34 | 11.1% |
| 3rd Grade | 56 | 18.3% |
| 4th Grade | 42 | 13.7% |
| 5th Grade | 37 | 12.1% |
| 6th Grade | 37 | 12.1% |
Teacher Education Background (2009)
Percent With Ph.D.
School:
5.3%
District:
16.7%
Percent With Master's Degree
School:
52.6%
District:
58.3%
Teacher Credentials & Experience (2009)
Percent of Teachers With Credentials: 100.0%
Number of Certificated Staff: 19.0
Average Number of Years of Teacher Experience: 8.8
Average Age
School:
37.9
District:
50.3
Source: CA Department of Education, Source: NCES 2009-2010
School Ratings and Reviews
Be The First To Review El Camino Elementary School!
School Map and Similar Schools Nearby
Click to Activate Map of Nearby School Campuses
Private
Public
This School
Similar Schools Nearby
| Hollister Elementary School KG-6 | 450 Students | 0.5 miles away | Not Yet Rated | |
| Foothill Elementary School KG-6 | 447 Students | 0.8 miles away | Not Yet Rated | |
| Mountain View Elementary School KG-6 | 359 Students | 1.5 miles away | Not Yet Rated | |
| Kellogg Elementary School KG-6 | 373 Students | 1.5 miles away | Not Yet Rated | |
| Vieja Valley Elementary School KG-6 | 345 Students | 1.5 miles away | Not Yet Rated | |
| Open Alternative School KG-8 | 174 Students | 2.4 miles away | Not Yet Rated | |
| Hope Elementary School KG-6 | 296 Students | 2.5 miles away | Not Yet Rated | |
| La Patera Elementary School KG-6 | 435 Students | 3.0 miles away | Not Yet Rated | |
| Monte Vista Elementary School KG-6 | 331 Students | 3.0 miles away | Not Yet Rated | |
| Adams Elementary School KG-6 | 506 Students | 3.6 miles away | Not Yet Rated | |
Compare This School To Nearby Schools ->
School Community Forum

Join a discussion about El Camino Elementary School and talk to others in the community including students, parents, teachers, and administrators.
Popular Discussion Topics
- Admissions and Registration Questions (e.g. Dress Code and Discipline Policy)
- School Calendar and Upcoming Events (e.g. Graduation)
- After School Programs, Extracurricular Activities, and Athletics (e.g. Football)
- News and Announcements (e.g. Yearbook and Class Supply List Details)
- Graduate and Alumni Events (e.g. Organizing Class Reunions)
Navigation
Can't Find What You Are Looking For?
Rankings
Nearby Cities
Sponsored Links
K-12 Articles

Internet Safety for Kids of All Ages
Kids are being introduced to the Internet at a very young age. Research for homework and school...
Kids are being introduced to the Internet at a very young age. Research for homework and school...

Simple Math ... a Simple Gift
Math affects every aspect of our lives-from balancing the checkbook to estimating the amount of...
Math affects every aspect of our lives-from balancing the checkbook to estimating the amount of...

The Importance of Ninth Grade
Students who are entering ninth grade do not realize the importance of the critical decisions they...
Students who are entering ninth grade do not realize the importance of the critical decisions they...