Clara Oliver Elementary School
Rating
Not Available
Not Available

No Reviews Yet
Find Old Friends From Clara Oliver Elementary School
Use the form below to search for alumni from Clara Oliver Elementary School.
School Description
School Summary and Highlights
- Enrolls 449 preschool and elementary school students from grades PK-5
- Ranks 4258th out of 4,319 elementary schools in TX.
- 2010 Overall School AYP Met Status: Yes
Additional Contact Information
- Principal or Admin: Karen Gosby
- Fax: (972) 749-3401
- Website: www.dallasisd.org
School Operational Details
- Title I EligibleAll students of this school are eligible for participation in authorized programs.
School District Details
- Dallas Independent School District (ISD)
- Per-Pupil Spending: $9,236
- Graduation Rate: 53.3%
- Dropout Rate: 8.9%
- Students Per Teacher: 15.0
- Enrolled Students: 157,092
Faculty Details and Student Enrollment
Students and Faculty
- Total Students Enrolled: 449
- Total Full Time "Equivalent" Teachers: 28.5
- Average Student-To-Teacher Ratio: 15.8
Students Gender Breakdown
- Males: 222 (49.4%)
- Females: 227 (50.6%)
Free Lunch Student Eligibility Breakdown
- Eligible for Reduced Lunch: 23 (5.1%)
- Eligible for Free Lunch: 385 (85.7%)
- Eligible for Either Reduced or Free Lunch: 408 (90.9%)
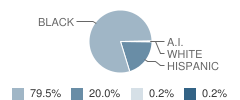
Student Enrollment Distribution by Race / Ethnicity
| Number | Percent | |
|---|---|---|
| American Indian | 1 | 0.2% |
| Black | 357 | 79.5% |
| Asian | - | - |
| Hispanic | 90 | 20.0% |
| White | 1 | 0.2% |
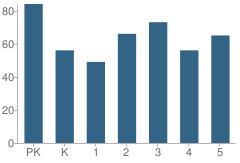
Number of Students Per Grade
| Number | Percent | |
|---|---|---|
| Pre-Kindergarten | 84 | 18.7% |
| Kindergarten | 56 | 12.5% |
| 1st Grade | 49 | 10.9% |
| 2nd Grade | 66 | 14.7% |
| 3rd Grade | 73 | 16.3% |
| 4th Grade | 56 | 12.5% |
| 5th Grade | 65 | 14.5% |
Faculty Breakdown (2010)
Average Teacher Experience
School:
11.2
District:
11.9
State:
11.3
Percent of Teachers With 1-5 Years Experience
School:
28.1%
District:
33.6%
State:
31.0%
Percent of Teachers With 6-10 Years Experience
School:
35.1%
District:
21.5%
State:
20.3%
Percent of Teachers With 11-20 Years Experience
School:
17.5%
District:
20.0%
State:
24.4%
Percent of Teachers With Greater Than 20 Years Experience
School:
19.3%
District:
21.0%
State:
18.3%
Faculty Salary (2010)
School Administration Average Base Salary
School:
$83,599
District:
$79,563
State:
$70,209
Teacher Average Base Salary
School:
$52,757
District:
$54,645
State:
$48,263
Teacher With 1-5 Years Experience Average Base Salary
School:
$46,370
State:
$43,527
Teacher With 6-10 Years Experience Average Base Salary
School:
$51,126
State:
$46,149
Teacher With 11-20 Years Experience Average Base Salary
School:
$53,653
State:
$50,153
Teacher With Greater Than 20 Years Experience Average Base Salary
School:
$64,200
State:
$58,427
Source: TX Department of Education, Source: NCES 2009-2010
School Ratings and Reviews
Be The First To Review Clara Oliver Elementary School!
School Map and Similar Schools Nearby
Click to Activate Map of Nearby School Campuses
Private
Public
This School
Similar Schools Nearby
| Lisbon Elementary School PK-5 | 415 Students | 0.9 miles away | Not Yet Rated | |
| Erasmo Seguin Elementary School PK-3 | 587 Students | 1.1 miles away | Not Yet Rated | |
| Thomas L Marsalis Elementary School PK-5 | 589 Students | 1.2 miles away |  5 out of 5 | |
| Clinton P Russell Elementary School 4-5 | 228 Students | 1.2 miles away | Not Yet Rated | |
| Whitney M Young Elementary School PK-5 | 550 Students | 1.5 miles away | Not Yet Rated | |
| Harry Stone Montessori School PK-6 | 388 Students | 1.5 miles away | Not Yet Rated | |
| John Neely Bryan Elementary School PK-5 | 621 Students | 1.5 miles away | Not Yet Rated | |
| Mark Twain Elementary School PK-5 | 398 Students | 1.5 miles away | 5 out of 5 | |
| Robert L Thornton Elementary School PK-5 | 539 Students | 1.6 miles away | Not Yet Rated | |
| Harrell Budd Elementary School PK-5 | 587 Students | 1.9 miles away | Not Yet Rated | |
Compare This School To Nearby Schools ->
School Community Forum

Join a discussion about Clara Oliver Elementary School and talk to others in the community including students, parents, teachers, and administrators.
Popular Discussion Topics
- Admissions and Registration Questions (e.g. Dress Code and Discipline Policy)
- School Calendar and Upcoming Events (e.g. Graduation)
- After School Programs, Extracurricular Activities, and Athletics (e.g. Football)
- News and Announcements (e.g. Yearbook and Class Supply List Details)
- Graduate and Alumni Events (e.g. Organizing Class Reunions)
Navigation
Can't Find What You Are Looking For?
Nearby Cities
Sponsored Links
K-12 Articles

Kids and Competition
In the backyard, the classroom, the community and while participating in sports and other...
In the backyard, the classroom, the community and while participating in sports and other...

Who is Safe?
Between September 26 and October 2, 2006, there were three deadly school shootings and...
Between September 26 and October 2, 2006, there were three deadly school shootings and...

Information on Cyberbullying
What is Cyberbullying? Cyberbullying is a new form of harassment, emotional abuse,...
What is Cyberbullying? Cyberbullying is a new form of harassment, emotional abuse,...